matplotlib绘制多子图共享鼠标光标的方法示例

matplotlib官方除了提供了鼠标十字光标的示例,还提供了同一图像内多子图共享光标的示例,其功能主要由widgets模块中的MultiCursor类提供支持。

MultiCursor类与Cursor类参数类似,差异主要在:

  • Cursor类参数只有一个ax,即需要显示光标的子图;MultiCursor类参数为canvasaxes,其中axes为需要共享光标的子图列表。
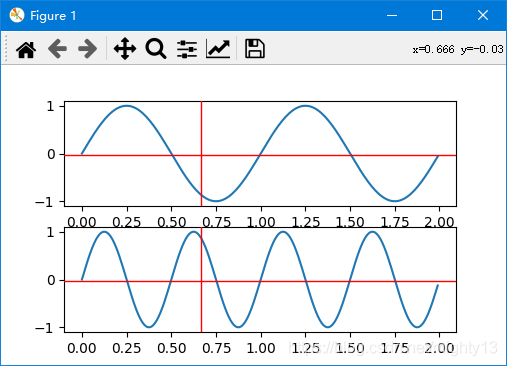
  • Cursor类中,光标默认是十字线;MultiCursor类中,光标默认为竖线。

官方示例

import numpy as np
import matplotlib.pyplot as plt
from matplotlib.widgets import MultiCursor

t = np.arange(0.0, 2.0, 0.01)
s1 = np.sin(2*np.pi*t)
s2 = np.sin(4*np.pi*t)

fig, (ax1, ax2) = plt.subplots(2, sharex=True)
ax1.plot(t, s1)
ax2.plot(t, s2)

multi = MultiCursor(fig.canvas, (ax1, ax2), color='r', lw=1)
plt.show()
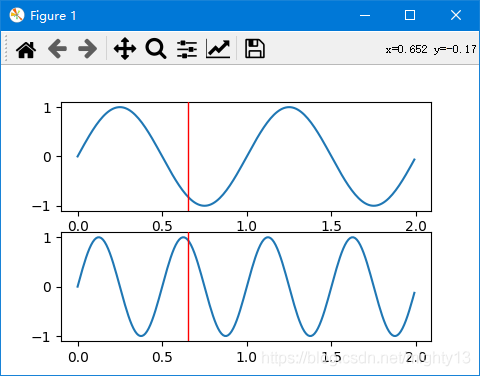
简易修改版

multi = MultiCursor(fig.canvas, (ax1, ax2), color='r', lw=1, horizOn=True, vertOn=True)
MultiCursor类源码

class MultiCursor(Widget):
  """
  Provide a vertical (default) and/or horizontal line cursor shared between
  multiple axes.

  For the cursor to remain responsive you must keep a reference to it.

  Example usage::

    from matplotlib.widgets import MultiCursor
    import matplotlib.pyplot as plt
    import numpy as np

    fig, (ax1, ax2) = plt.subplots(nrows=2, sharex=True)
    t = np.arange(0.0, 2.0, 0.01)
    ax1.plot(t, np.sin(2*np.pi*t))
    ax2.plot(t, np.sin(4*np.pi*t))

    multi = MultiCursor(fig.canvas, (ax1, ax2), color='r', lw=1,
              horizOn=False, vertOn=True)
    plt.show()

  """
  def __init__(self, canvas, axes, useblit=True, horizOn=False, vertOn=True,
         **lineprops):

    self.canvas = canvas
    self.axes = axes
    self.horizOn = horizOn
    self.vertOn = vertOn

    xmin, xmax = axes[-1].get_xlim()
    ymin, ymax = axes[-1].get_ylim()
    xmid = 0.5 * (xmin + xmax)
    ymid = 0.5 * (ymin + ymax)

    self.visible = True
    self.useblit = useblit and self.canvas.supports_blit
    self.background = None
    self.needclear = False

    if self.useblit:
      lineprops['animated'] = True

    if vertOn:
      self.vlines = [ax.axvline(xmid, visible=False, **lineprops)
              for ax in axes]
    else:
      self.vlines = []

    if horizOn:
      self.hlines = [ax.axhline(ymid, visible=False, **lineprops)
              for ax in axes]
    else:
      self.hlines = []

    self.connect()

  def connect(self):
    """Connect events."""
    self._cidmotion = self.canvas.mpl_connect('motion_notify_event',
                         self.onmove)
    self._ciddraw = self.canvas.mpl_connect('draw_event', self.clear)

  def disconnect(self):
    """Disconnect events."""
    self.canvas.mpl_disconnect(self._cidmotion)
    self.canvas.mpl_disconnect(self._ciddraw)

  def clear(self, event):
    """Clear the cursor."""
    if self.ignore(event):
      return
    if self.useblit:
      self.background = (
        self.canvas.copy_from_bbox(self.canvas.figure.bbox))
    for line in self.vlines + self.hlines:
      line.set_visible(False)

  def onmove(self, event):
    if self.ignore(event):
      return
    if event.inaxes is None:
      return
    if not self.canvas.widgetlock.available(self):
      return
    self.needclear = True
    if not self.visible:
      return
    if self.vertOn:
      for line in self.vlines:
        line.set_xdata((event.xdata, event.xdata))
        line.set_visible(self.visible)
    if self.horizOn:
      for line in self.hlines:
        line.set_ydata((event.ydata, event.ydata))
        line.set_visible(self.visible)
    self._update()

  def _update(self):
    if self.useblit:
      if self.background is not None:
        self.canvas.restore_region(self.background)
      if self.vertOn:
        for ax, line in zip(self.axes, self.vlines):
          ax.draw_artist(line)
      if self.horizOn:
        for ax, line in zip(self.axes, self.hlines):
          ax.draw_artist(line)
      self.canvas.blit()
    else:
      self.canvas.draw_idle()

到此这篇关于matplotlib绘制多子图共享鼠标光标的方法示例的文章就介绍到这了,更多相关matplotlib 多子图鼠标光标内容请搜索我们以前的文章或继续浏览下面的相关文章希望大家以后多多支持我们!

(0)

相关推荐

  • matplotlib绘制鼠标的十字光标的实现(内置方式)

    相对于echarts等基于JavaScript的图表库,matplotlib的交互能力相对较差. 在实际应用中,我们经常想使用十字光标来定位数据坐标,matplotlib内置提供支持. 官方示例 matplotlib提供了官方示例https://matplotlib.org/gallery/widgets/cursor.html from matplotlib.widgets import Cursor import numpy as np import matplotlib.pyplot as

  • matplotlib自定义鼠标光标坐标格式的实现

    matplotlib默认在图像Windows窗口中显示当前鼠标光标所在位置的坐标,格式为x=xx, y=xx. 鼠标光标的坐标格式由子图模块Axes中的format_coord函数控制. 通过重写format_coord函数即可实现坐标的自定义格式. 注意:调用format_coord函数的对象是子图对象,常见的错误主要在没有正确的获取当前子图对象. format_coord函数源码 matplotlib.axes.Axes.format_coord def format_coord(self,

  • matplotlib绘制多子图共享鼠标光标的方法示例

    matplotlib官方除了提供了鼠标十字光标的示例,还提供了同一图像内多子图共享光标的示例,其功能主要由widgets模块中的MultiCursor类提供支持. MultiCursor类与Cursor类参数类似,差异主要在: Cursor类参数只有一个ax,即需要显示光标的子图:MultiCursor类参数为canvas和axes,其中axes为需要共享光标的子图列表. Cursor类中,光标默认是十字线:MultiCursor类中,光标默认为竖线. 官方示例 import numpy as

  • Python使用matplotlib绘制多个图形单独显示的方法示例

    本文实例讲述了Python使用matplotlib绘制多个图形单独显示的方法.分享给大家供大家参考,具体如下: 一 代码 import numpy as np import matplotlib.pyplot as plt #创建自变量数组 x= np.linspace(0,2*np.pi,500) #创建函数值数组 y1 = np.sin(x) y2 = np.cos(x) y3 = np.sin(x*x) #创建图形 plt.figure(1) ''' 意思是在一个2行2列共4个子图的图中,

  • Python+matplotlib绘制多子图的方法详解

    目录 本文速览 1.matplotlib.pyplot api 方式添加子图 2.面向对象方式添加子图 3.matplotlib.pyplot add_subplot方式添加子图 4.matplotlib.gridspec.GridSpec方式添加子图 5.子图中绘制子图 6.任意位置绘制子图(plt.axes) 本文速览 matplotlib.pyplot api 绘制子图 面向对象方式绘制子图 matplotlib.gridspec.GridSpec绘制子图 任意位置添加子图 关于pyplo

  • Python Matplotlib绘制多子图详解

    通过获取子图的label和线型来合并图例 注意添加label #导入数据(读者可忽略) pre_lp=total_res#组合模型 true=diff1[-pre_day:]#真实值 pre_ph=results_data["yhat"]#prophet pre_lstm=reslut#lstm pre_ari=data_ari['data_pre']#arima #设置中文字体 rcParams['font.sans-serif'] = 'kaiti' # 生成一个时间序列 (读者可

  • Python使用matplotlib绘制余弦的散点图示例

    本文实例讲述了Python使用matplotlib绘制余弦的散点图.分享给大家供大家参考,具体如下: 一 代码 import numpy as np import pylab as pl a = np.arange(0,2.0*np.pi,0.1) b = np.cos(a) #绘制散点图 pl.scatter(a,b) pl.show() 二 运行结果 三 修改散点符号代码 import numpy as np import pylab as pl a = np.arange(0,2.0*np

  • matplotlib绘制鼠标的十字光标的实现(自定义方式,官方实例)

    matplotlib在widgets模块提供Cursor类用于支持十字光标的生成.另外官方还提供了自定义十字光标的实例. widgets模块Cursor类源码 class Cursor(AxesWidget): """ A crosshair cursor that spans the axes and moves with mouse cursor. For the cursor to remain responsive you must keep a reference

  • matplotlib subplot绘制多个子图的方法示例

    在matplotlib下,一个Figure对象可以包含多个子图(Axes),可以使用subplot()快速绘制,其调用形式如下: subplot(numRows, numCols, plotNum) 图表的整个绘图区域被分成numRows行和numCols列,plotNum参数指定创建的Axes对象所在的区域,如何理解呢? 如果numRows = 3,numCols = 2,那整个绘制图表样式为3X2的图片区域,用坐标表示为(1,1),(1,2),(1,3),(2,1),(2,2),(2,3).

  • matplotlib.subplot()画子图并共享y坐标轴的方法

    有时候想要把几张图放在一起plot,比较好对比,subplot和subplots都可以实现,具体对比可以查看参考博文.这里用matplotlib库的subplot来举个栗子. 数据长什么样 有两个数据段,第一个数据是DataFrame类型,第二个是ndarray类型.每个数据都有3列,我想画1*3的折线子图,第一个数据的第n列和第二个数据的第n列画在一张子图上.先来看一下两个数据长什么样儿(为显示方便,只看前5行). In [1]: testing_set.head() # DataFrame类

随机推荐