springcloud 熔断监控Hystrix Dashboard和Turbine
Hystrix-dashboard是一款针对Hystrix进行实时监控的工具,通过Hystrix Dashboard我们可以在直观地看到各Hystrix Command的请求响应时间, 请求成功率等数据。但是只使用Hystrix Dashboard的话, 你只能看到单个应用内的服务信息, 这明显不够. 我们需要一个工具能让我们汇总系统内多个服务的数据并显示到Hystrix Dashboard上, 这个工具就是Turbine.
Hystrix Dashboard
我们在熔断示例项目spring-cloud-consumer-hystrix的基础上更改,重新命名为:spring-cloud-consumer-hystrix-dashboard。
1、添加依赖
<dependency>
 <groupId>org.springframework.cloud</groupId>
 <artifactId>spring-cloud-starter-hystrix</artifactId>
</dependency>
<dependency>
 <groupId>org.springframework.cloud</groupId>
 <artifactId>spring-cloud-starter-hystrix-dashboard</artifactId>
</dependency>
<dependency>
 <groupId>org.springframework.boot</groupId>
 <artifactId>spring-boot-starter-actuator</artifactId>
</dependency>
这三个包必须添加
2、启动类
启动类添加启用Hystrix Dashboard和熔断器
@SpringBootApplication
@EnableDiscoveryClient
@EnableFeignClients
@EnableHystrixDashboard
@EnableCircuitBreaker
public class ConsumerApplication {

 public static void main(String[] args) {
 SpringApplication.run(ConsumerApplication.class, args);
 }
}
3、测试
启动工程后访问 http://localhost:9001/hystrix,将会看到如下界面:
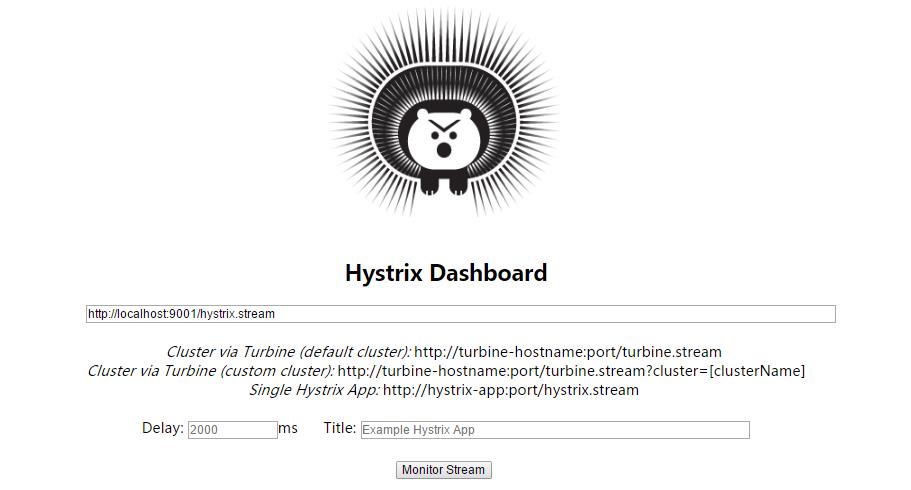
图中会有一些提示:
Cluster via Turbine (default cluster): http://turbine-hostname:port/turbine.stream
Cluster via Turbine (custom cluster): http://turbine-hostname:port/turbine.stream?cluster=[clusterName]
Single Hystrix App: http://hystrix-app:port/hystrix.stream
大概意思就是如果查看默认集群使用第一个url,查看指定集群使用第二个url,单个应用的监控使用最后一个,我们暂时只演示单个应用的所以在输入框中输入:
http://localhost:9001/hystrix.stream ,输入之后点击 monitor,进入页面。
如果没有请求会先显示Loading ...,访问http://localhost:9001/hystrix.stream 也会不断的显示ping。
请求服务http://localhost:9001/hello/neo,就可以看到监控的效果了,首先访问http://localhost:9001/hystrix.stream,显示如下:
ping:
data: {"type":"HystrixCommand","name":"HelloRemote#hello(String)","group":"spring-cloud-producer","currentTime":1494915453986,"isCircuitBreakerOpen":false,"errorPercentage":100,"errorCount":1,"requestCount":1,"rollingCountBadRequests":0,"rollingCountCollapsedRequests":0,"rollingCountEmit":0,"rollingCountExceptionsThrown":0,"rollingCountFailure":0,"rollingCountFallbackEmit":0,"rollingCountFallbackFailure":0,"rollingCountFallbackMissing":0,"rollingCountFallbackRejection":0,"rollingCountFallbackSuccess":1,"rollingCountResponsesFromCache":0,"rollingCountSemaphoreRejected":0,"rollingCountShortCircuited":0,"rollingCountSuccess":0,"rollingCountThreadPoolRejected":0,"rollingCountTimeout":1,"currentConcurrentExecutionCount":0,"rollingMaxConcurrentExecutionCount":0,"latencyExecute_mean":0,"latencyExecute":{"0":0,"25":0,"50":0,"75":0,"90":0,"95":0,"99":0,"99.5":0,"100":0},"latencyTotal_mean":0,"latencyTotal":{"0":0,"25":0,"50":0,"75":0,"90":0,"95":0,"99":0,"99.5":0,"100":0},"propertyValue_circuitBreakerRequestVolumeThreshold":20,"propertyValue_circuitBreakerSleepWindowInMilliseconds":5000,"propertyValue_circuitBreakerErrorThresholdPercentage":50,"propertyValue_circuitBreakerForceOpen":false,"propertyValue_circuitBreakerForceClosed":false,"propertyValue_circuitBreakerEnabled":true,"propertyValue_executionIsolationStrategy":"THREAD","propertyValue_executionIsolationThreadTimeoutInMilliseconds":1000,"propertyValue_executionTimeoutInMilliseconds":1000,"propertyValue_executionIsolationThreadInterruptOnTimeout":true,"propertyValue_executionIsolationThreadPoolKeyOverride":null,"propertyValue_executionIsolationSemaphoreMaxConcurrentRequests":10,"propertyValue_fallbackIsolationSemaphoreMaxConcurrentRequests":10,"propertyValue_metricsRollingStatisticalWindowInMilliseconds":10000,"propertyValue_requestCacheEnabled":true,"propertyValue_requestLogEnabled":true,"reportingHosts":1,"threadPool":"spring-cloud-producer"}
data: {"type":"HystrixThreadPool","name":"spring-cloud-producer","currentTime":1494915453986,"currentActiveCount":0,"currentCompletedTaskCount":1,"currentCorePoolSize":10,"currentLargestPoolSize":1,"currentMaximumPoolSize":10,"currentPoolSize":1,"currentQueueSize":0,"currentTaskCount":1,"rollingCountThreadsExecuted":0,"rollingMaxActiveThreads":0,"rollingCountCommandRejections":0,"propertyValue_queueSizeRejectionThreshold":5,"propertyValue_metricsRollingStatisticalWindowInMilliseconds":10000,"reportingHosts":1}
说明已经返回了监控的各项结果
到监控页面就会显示如下图:
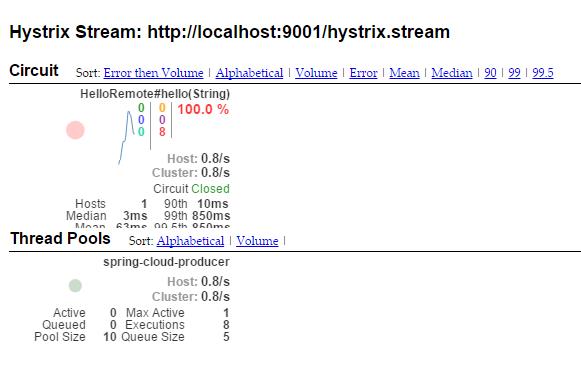
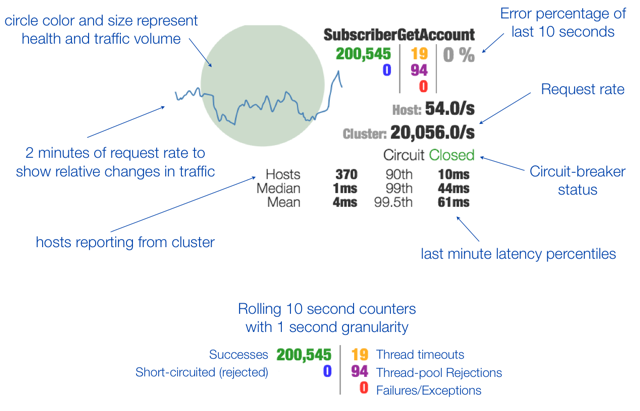
其实就是http://localhost:9001/hystrix.stream返回结果的图形化显示,Hystrix Dashboard Wiki上详细说明了图上每个指标的含义,如下图:
到此单个应用的熔断监控已经完成。
Turbine
在复杂的分布式系统中,相同服务的节点经常需要部署上百甚至上千个,很多时候,运维人员希望能够把相同服务的节点状态以一个整体集群的形式展现出来,这样可以更好的把握整个系统的状态。 为此,Netflix提供了一个开源项目(Turbine)来提供把多个hystrix.stream的内容聚合为一个数据源供Dashboard展示。
1、添加依赖
<dependencies>
 <dependency>
 <groupId>org.springframework.cloud</groupId>
 <artifactId>spring-cloud-starter-turbine</artifactId>
 </dependency>
 <dependency>
 <groupId>org.springframework.cloud</groupId>
 <artifactId>spring-cloud-netflix-turbine</artifactId>
 </dependency>
 <dependency>
 <groupId>org.springframework.boot</groupId>
 <artifactId>spring-boot-starter-actuator</artifactId>
 </dependency>
 <dependency>
 <groupId>org.springframework.cloud</groupId>
 <artifactId>spring-cloud-starter-hystrix-dashboard</artifactId>
 </dependency>
</dependencies>
2、配置文件
spring.application.name=hystrix-dashboard-turbine
server.port=8001
turbine.appConfig=node01,node02
turbine.aggregator.clusterConfig= default
turbine.clusterNameExpression= new String("default")

eureka.client.serviceUrl.defaultZone=http://localhost:8000/eureka/
turbine.appConfig:配置Eureka中的serviceId列表,表明监控哪些服务turbine.aggregator.clusterConfig:指定聚合哪些集群,多个使用”,”分割,默认为default。可使用http://.../turbine.stream?cluster={clusterConfig之一}访问turbine.clusterNameExpression: 1. clusterNameExpression指定集群名称,默认表达式appName;此时:turbine.aggregator.clusterConfig需要配置想要监控的应用名称;2. 当clusterNameExpression: default时,turbine.aggregator.clusterConfig可以不写,因为默认就是default;3. 当clusterNameExpression: metadata[‘cluster']时,假设想要监控的应用配置了eureka.instance.metadata-map.cluster: ABC,则需要配置,同时turbine.aggregator.clusterConfig: ABC
3、启动类
启动类添加@EnableTurbine,激活对Turbine的支持
@SpringBootApplication
@EnableHystrixDashboard
@EnableTurbine
public class DashboardApplication {

 public static void main(String[] args) {
 SpringApplication.run(DashboardApplication.class, args);
 }

}
到此Turbine(hystrix-dashboard-turbine)配置完成
4、测试
在示例项目spring-cloud-consumer-hystrix基础上修改为两个服务的调用者spring-cloud-consumer-node1和spring-cloud-consumer-node2
spring-cloud-consumer-node1项目改动如下:
application.properties文件内容
spring.application.name=node01
server.port=9001
feign.hystrix.enabled=true

eureka.client.serviceUrl.defaultZone=http://localhost:8000/eureka/
spring-cloud-consumer-node2项目改动如下:
application.properties文件内容
spring.application.name=node02
server.port=9002
feign.hystrix.enabled=true

eureka.client.serviceUrl.defaultZone=http://localhost:8000/eureka/
HelloRemote类修改:
@FeignClient(name= "spring-cloud-producer2", fallback = HelloRemoteHystrix.class)
public interface HelloRemote {

 @RequestMapping(value = "/hello")
 public String hello2(@RequestParam(value = "name") String name);

}
对应的HelloRemoteHystrix和ConsumerController类跟随修改,具体查看代码
修改完毕后,依次启动spring-cloud-eureka、spring-cloud-consumer-node1、spring-cloud-consumer-node1、hystrix-dashboard-turbine(Turbine)
打开eureka后台可以看到注册了三个服务:

访问 http://localhost:8001/turbine.stream
返回:
: ping
data: {"reportingHostsLast10Seconds":1,"name":"meta","type":"meta","timestamp":1494921985839}
并且会不断刷新以获取实时的监控数据,说明和单个的监控类似,返回监控项目的信息。进行图形化监控查看,输入:http://localhost:8001/hystrix,返回酷酷的小熊界面,输入: http://localhost:8001/turbine.stream,然后点击 Monitor Stream ,可以看到出现了俩个监控列表

参考:
以上就是本文的全部内容,希望对大家的学习有所帮助,也希望大家多多支持我们。
相关推荐
-

SpringCloud中的断路器(Hystrix)和断路器监控(Dashboard)
前言 本篇主要介绍的是SpringCloud中的断路器(Hystrix)和断路器指标看板(Dashboard)的相关使用知识. SpringCloud Hystrix Hystrix 介绍 Netflix创建了一个名为Hystrix的库,它实现了断路器模式.主要的目的是为了解决服务雪崩效应的一个组件,是保护服务高可用的最后一道防线. 开发准备 开发环境 •JDK:1.8 •SpringBoot:2.1.1.RELEASE •SpringCloud:Finchley 注:不一定非要用上述的版本,可
-
SpringCloud Hystrix-Dashboard仪表盘的实现
Hystrix Dashboard,它主要用来实时监控Hystrix的各项指标信息.通过Hystrix Dashboard反馈的实时信息,可以帮助我们快速发现系统中存在的问题.下面通过一个例子来学习. 一.新建一个Spring Cloud 项目,命名为hystrix-dashboard 1.1在pom.xml引入相关的依赖 <dependency> <groupId>org.springframework.cloud</groupId> <artifactId&g
-
springcloud 熔断监控Hystrix Dashboard和Turbine
Hystrix-dashboard是一款针对Hystrix进行实时监控的工具,通过Hystrix Dashboard我们可以在直观地看到各Hystrix Command的请求响应时间, 请求成功率等数据.但是只使用Hystrix Dashboard的话, 你只能看到单个应用内的服务信息, 这明显不够. 我们需要一个工具能让我们汇总系统内多个服务的数据并显示到Hystrix Dashboard上, 这个工具就是Turbine. Hystrix Dashboard 我们在熔断示例项目spring-c
-
SpringCloud之熔断监控Hystrix Dashboard的实现
前言 SpringCloud 是微服务中的翘楚,最佳的落地方案. SpringCloud 中的 Hystrix 组件可以实现熔断,而在实际情况中,一般还需要直观地看到各个服务的调用情况, 这时,就用到了 SpringCloud 另一个组件:Hystrix Dashboard. Hystrix Dashboard 是一款针对于 Hystrix 进行实时监控的工具,还提供了友好的图形化界面. 源码 GitHub地址:https://github.com/intomylife/SpringCloud
-
SpringCloud之监控数据聚合Turbine的实现
前言 SpringCloud 是微服务中的翘楚,最佳的落地方案. 使用 SpringCloud 的 Hystrix Dashboard 组件可以监控单个应用服务的调用情况,但如果是集群环境,可能就 不能满足需求了,这时就用到了 SpringCloud 另一个组件:Turbine. Turbine 将每个应用服务的调用情况聚合在一起展示出来. 如果了解过 Hystrix Dashboard,那么可以简单认为 Turbine 就相当于另起了一个工程,把其他工程的监控情况 全部显示到了 Turbine
-
解析springcloud中的Hystrix
一.简介 源码地址:https://gitee.com/xiaocheng0902/my-cloud.git 1,定义 Hystrix是一个用于处理分布式系统的延迟和容错的开源库,在分布式系统里,许多依赖不可避免的会调用失败,比如超时.异常等.Hystrix能够保证在一个依赖出问题的情况下,不会导致整体服务失败,避免级联故障,以提高分布式系统的弹性. "断路器"本身是一种开关装置,当某个服务单元发生故障之后,通过断路器的故障监控(类似熔断保险丝),向调用方返回一个符合预期的.可处理的备
-
SpringCloud之熔断器Hystrix的实现
前言 SpringCloud 是微服务中的翘楚,最佳的落地方案. 在微服务架构中多层服务之间会相互调用,如果其中有一层服务故障了,可能会导致一层服务或者多层服务 故障,从而导致整个系统故障.这种现象被称为服务雪崩效应. SpringCloud 中的 Hystrix 组件就可以解决此类问题,Hystrix 负责监控服务之间的调用情况,连续多次失败的 情况进行熔断保护.保护的方法就是使用 Fallback,当调用的服务出现故障时,就可以使用 Fallback 方法的 返回值:Hystrix 间隔时间
-
详解springcloud Feign的Hystrix支持
本文介绍了springcloud Feign的Hystrix支持,分享给大家,具体如下: 一.Feign client中加入Hystrix的fallback @FeignClient(name="springboot-h2", fallback=HystrixClientFallback.class) //在fallback属性中指定断路器的fallback public interface UserFeignClient { // @GetMapping("/user/{i
-
SpringCloud Hystrix熔断器使用方法介绍
目录 Hystrix(hi si ju ke si)概述 Hystix 主要功能 隔离 Hystrix 降级 Hystrix降级-服务提供方 初始化程序和Fiegn程序一致 Hystrix降级-服务消费方 provider与Fiegin一致 Hystrix 熔断 Hystrix 熔断监控 Turbine聚合监控 搭建监控模块 修改被监控模块 启动测试 Hystrix(hi si ju ke si)概述 Hystix 是 Netflix 开源的一个延迟和容错库,用于隔离访问远程服务.第三方库,防止
-
一文读懂Spring Cloud-Hystrix
Hystrix概述 Hystrix:断路器,容错管理工具,旨在通过熔断机制控制服务和第三方库的节点,从而对延迟和故障提供更强大的容错能力. hystrix可以实现降级和熔断: 降级 调用远程服务失败(宕机.500错.超时),可以降级执行当前服务中的一段代码,向客户端返回结果 快速失败 熔断 当访问量过大,出现大量失败,可以做过热保护,断开远程服务不再调用 限流 防止故障传播.雪崩效应 在微服务系统中,服务之间进行依赖,避免有调用其中服务失败,而引起其他服务大范围宕机,造成雪崩效应,hystrix
-
Springcloud hystrix服务熔断和dashboard如何实现
服务在经过一定负荷之后,如果达到一定上限之后会中断进行报错,而服务调用的方法也会报错等等,一旦整体服务停下,别的客户端再来访问就会无法调用.对此需要进行另外一种服务熔断模式. 不同于现实中的熔断保险丝,服务熔断是在系统服务达到一定错误之后,自动熔断降级,采取备用方法,但是在一定时间后客户端再次调用成功后,一定时间内成功率上去,系统的熔断机制会慢慢的关闭,恢复到正常请求的状态. 本篇接上一章直接改动. 1.主启动类加上新的注解. @EnableCircuitBreaker 2.service写入新