Python构建简单线性回归模型
目录
- 线性回归模型
- 1.加载数据
- 2.划分训练集和测试集
- 3.训练模型
- 4.预测数据
- 5.画图展示线性拟合情况
- 6.预测数据测试
- 评估模型精度
- 1.计算回归模型精度
- 模型持久化
前言:
本文介绍如何构建简单线性回归模型及计算其准确率,最后介绍如何持久化模型。
线性回归模型
线性回归表示发现函数使用线性组合表示输入变量。简单线性回归很容易理解,使用了基本的回归技术,一旦理解了这些基本概念,可以更好地学习其他类型的回归模型。
回归用于发现输入变量和输出变量之间的关系,一般变量为实数。我们的目标是估计映射从输入到输出的映射核函数。
下面从一个简单示例开始:
1 --> 2
3 --> 6
4.3 --> 8.6
1.1 --> 14.2
看到上面数据,估计你已经看出它们之间的关系:f(x) = 2x
但是现实数据不会这么直接。下面示例数据来自Vehicles.txt文件。每行数据使用逗号分割,第一个数据为输入数据,第二个为输出数据,我们的目标是发现线性回归关系:基于汽车登记量估计省份人口数量。
示例数据如下:
145263, 127329
204477, 312027
361034, 573694
616716, 891181
885665, 1059114
773600, 1221218
850513, 1326513
996733, 1543752
827967, 1571053
1011436,1658138
1222738,1970521
2404651,3744398
2259795,4077166
2844588,4404246
2774071,4448146
3011089,4915123
3169307,5074261
3346791,5850850
3702114,5888472
5923476,10008349
1.加载数据
import numpy as np
from sklearn import linear_model
import matplotlib.pyplot as plt
import sklearn.metrics as sm
import pickle
filename = "data/vehicles.txt"
x = []
y = []

with open(filename, 'r') as lines:
    for line in lines:
        xt, yt = [float(i) for i in line.split(',')]
        x.append(xt)
        y.append(yt)
上面代码加载文件至x,y变量中,x是自变量,y是响应变量。在循环内读取每一行,然后基于逗号分裂为两个变量并转为浮点型。
2.划分训练集和测试集
构建机器学习模型,需要划分训练集和测试集,训练集用于构建模型,测试集用于验证模型并检查模型是否满足要求。
num_training = int(0.8 * len(x))
num_test = len(x) - num_training

# 训练数据占80%
x_train = np.array(x[: num_training]).reshape((num_training, 1))
y_train = np.array(y[: num_training])

# 测试数据占20%
x_test = np.array(x[num_training:]).reshape((num_test, 1))
y_test = np.array(y[num_training:])
首先取80%数据作为训练集,剩余的作为测试集。这时我们构造了四个数组:x_train,x_test,y_train,y_test。
3.训练模型
现在准备训练模型,需要使用regressor对象。
# Create linear regression object
linear_regressor = linear_model.LinearRegression()

# Train the model using the training sets
linear_regressor.fit(x_train, y_train)
首先从sklearn库中导入linear_model方法,用于实现线性回归,里面包括目标值:输入变量的线性组合。然后使用LinearRegression() 函数执行最小二乘法执行线性回归。最后fit函数用于拟合线性模型,需要传入两个参数:x_train,y_train。
4.预测数据
上面基于训练集拟合线性模型,使用fit方法接收训练数据训练模型。为了查看拟合程度,我们可以使用训练数据进行预测:
y_train_pred = linear_regressor.predict(X_train)
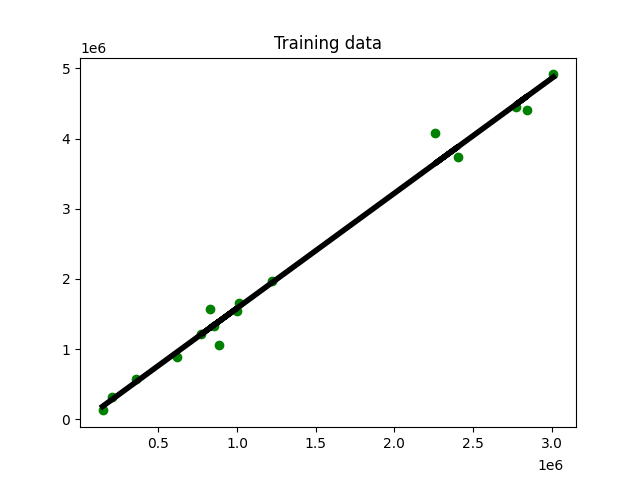
5.画图展示线性拟合情况
plt.figure()
plt.scatter(x_train, y_train, color='green')
plt.plot(x_train, y_train_pred, color='black', linewidth=4)
plt.title('Training data')
plt.show()
生成图示如下:

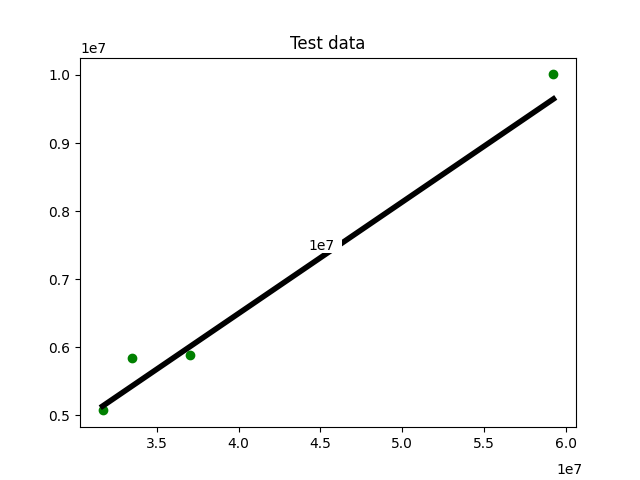
前面使用训练模型预测训练数据。对于未知数据不能确定模型性能,我们需要基于测试数据进行测试。
6.预测数据测试
下面基于测试数据进行预测并画图展示:
y_test_pred = linear_regressor.predict(x_test)
plt.figure()
plt.scatter(x_test, y_test, color='green')
plt.plot(x_test, y_test_pred, color='black', linewidth=4)
plt.title('Test data')
plt.show()

与我们预想的一致,省人口与汽车注册量成正相关。
评估模型精度
上面构建了回归模型,但我们需要评估模型的质量。这里我们定义错误为实际值与预测值之间的差异,下面我们看如何计算回归模型的精度。
1.计算回归模型精度
print("MAE =", round(sm.mean_absolute_error(y_test, y_test_pred), 2))
print("MSE =", round(sm.mean_squared_error(y_test,  y_test_pred), 2))
print("Median absolute error =",
      round(sm.median_absolute_error(y_test, y_test_pred), 2))
print("Explain variance score =",
      round(sm.explained_variance_score(y_test, y_test_pred), 2))
print("R2 score =", round(sm.r2_score(y_test, y_test_pred), 2))
输出结果:
MAE = 241907.27
MSE = 81974851872.13
Median absolute error = 240861.94
Explain variance score = 0.98
R2 score = 0.98
R2得分接近1表示模型预测效果非常好。计算每个指标会很麻烦,一般选择一两个指标来评估模型。一个好的做法是MSE较低,解释方差得分较高。
- Mean absolute error: 所有数据集的平均绝对值误差
- Mean squared error: 所有数据集的平均误差平方,是最常用的指标之一。
- Median absolute error: 所有数据集的误差中位数,该指标主要用于消除异常值影响
- Explained variance score: 模型在多大程度上能够解释数据集中的变化。1.0的分数表明我们的模型是完美的。
- R2 score: 这被读作r²,是决定系数。表示模型对未知样本的预测程度。最好的分数是1.0,但也可以是负值。
模型持久化
训练完模型,可以保存至文件中,下次需要模型预测可直接从文件加载。
下面看如何持久化模型。需要使用pickle模块,实现存储Python对象,它是Python标准库的一部分。
# 写入文件
output_model_file = "3_model_linear_regr.pkl"
with open(output_model_file, ' wb') as f:
    pickle.dump(linear_regressor, f)

# 加载使用
with open(output_model_file, ' rb') as f:
    model_linregr = pickle.load(f)

y_test_pred_new = model_linregr.predict(x_test)
print("New mean absolute error =",
      round(sm.mean_absolute_error(y_test, y_test_pred_new), 2))
输出结果:
New mean absolute error = 241907.27
这里从文件加载数据至model_linregr变量,预测结果与上面一致。
到此这篇关于Python构建简单线性回归模型的文章就介绍到这了,更多相关Python线性回归内容请搜索我们以前的文章或继续浏览下面的相关文章希望大家以后多多支持我们!

