WPF实现绘制统计图(柱状图)的方法详解
目录
- 前言
- 实现代码
- 效果预览
前言
有小伙伴提出需要实现统计图。

由于在WPF中没有现成的统计图控件,所以我们自己实现一个。
PS:有更好的方式欢迎推荐。
实现代码
一、创建 BasicBarChart.cs 继承 Control代码如下。
BasicBarChart.cs实现思路如下
1、SeriesArray :存放展示集合 。
2、重写OnRender 。
3、先绘制X轴线。
4、调用GetFormattedText()绘制底部类别。
5、调用GetFormattedText()绘制左侧标尺。
6、DrawingContext绘制Line的时候会发虚,以下方法可以避免
var d = Pen.Thickness / 2;
var guidelines = new GuidelineSet(new[] { d }, new[] { d });
drawingContext.PushGuidelineSet(guidelines);
或者调用
SnapDrawingExtensions.DrawSnappedLinesBetweenPoints()
避免画线发虚。
using System;
using System.Collections.Generic;
using System.Globalization;
using System.Linq;
using System.Windows;
using System.Windows.Controls;
using System.Windows.Media;
namespace WPFDevelopers.Controls
{
public class BasicBarChart : Control
{
public IEnumerable<KeyValuePair<string, double>> SeriesArray
{
get { return (IEnumerable<KeyValuePair<string, double>>)GetValue(SeriesArrayProperty); }
set { SetValue(SeriesArrayProperty, value); }
}
public static readonly DependencyProperty SeriesArrayProperty =
DependencyProperty.Register("SeriesArray", typeof(IEnumerable<KeyValuePair<string, double>>), typeof(BasicBarChart), new UIPropertyMetadata(SeriesArrayChanged));
private static void SeriesArrayChanged(DependencyObject d, DependencyPropertyChangedEventArgs e)
{
BasicBarChart radarChart = d as BasicBarChart;
if (e.NewValue != null)
radarChart.InvalidateVisual();
}
static BasicBarChart()
{
DefaultStyleKeyProperty.OverrideMetadata(typeof(BasicBarChart), new FrameworkPropertyMetadata(typeof(BasicBarChart)));
}
protected override void OnRender(DrawingContext drawingContext)
{
//base.OnRender(drawingContext);
if (SeriesArray == null || SeriesArray.Count() == 0)
return;
SnapsToDevicePixels = true;
UseLayoutRounding = true;
var brushConverter = new BrushConverter();
var myPen = new Pen
{
Thickness = 1,
Brush = (Brush)brushConverter.ConvertFromString("#6E7079")
};
myPen.Freeze();
//var d = myPen.Thickness / 2;
//var guidelines = new GuidelineSet(new[] { d }, new[] { d });
//drawingContext.PushGuidelineSet(guidelines);
var h = this.ActualHeight / 2 + 160;
var w = this.ActualWidth / 2;
var startX = w / 3;
var width = SeriesArray.Count() * 120 + startX;
//drawingContext.DrawLine(myPen, new Point(startX, h), new Point(width, h));
var stratNum = 0;
SnapDrawingExtensions.DrawSnappedLinesBetweenPoints(drawingContext,myPen,myPen.Thickness, new Point(startX, h), new Point(width, h));
var formattedText = GetFormattedText(stratNum.ToString());
drawingContext.DrawText(formattedText, new Point(startX - formattedText.Width * 2 - 10, h - formattedText.Height / 2));
var x = startX;
//var y = h + d;
var y = h + myPen.Thickness;
var points = new List<Point>();
var rectBrush = new SolidColorBrush((Color)ColorConverter.ConvertFromString("#5470C6"));
for (int i = 0; i < SeriesArray.Count() + 1; i++)
{
//drawingContext.DrawLine(myPen, new Point(x, y), new Point(x, y + 4));
points.Add(new Point(x, y));
points.Add(new Point(x, y + 4));
x = x + 120;
}
SnapDrawingExtensions.DrawSnappedLinesBetweenPoints(drawingContext, myPen, myPen.Thickness, points.ToArray());
var xAxisPen = new Pen
{
Thickness = 1,
Brush = (Brush)brushConverter.ConvertFromString("#E0E6F1")
};
xAxisPen.Freeze();
var xAxis = h - 80;
int max = Convert.ToInt32(SeriesArray.Max(kvp => kvp.Value));
max = (max / 50 + (max % 50 == 0 ? 0 : 1)) * 50 / 50;
int min = Convert.ToInt32(SeriesArray.Min(kvp => kvp.Value));
points.Clear();
for (int i = 0; i < max; i++)
{
//drawingContext.DrawLine(xAxisPen, new Point(startX, xAxis), new Point(width, xAxis));
points.Add(new Point(startX, xAxis));
points.Add(new Point(width, xAxis));
stratNum += 50;
formattedText = GetFormattedText(stratNum.ToString());
drawingContext.DrawText(formattedText, new Point(startX - formattedText.Width - 10, xAxis - formattedText.Height / 2));
xAxis = xAxis - 80;
}
SnapDrawingExtensions.DrawSnappedLinesBetweenPoints(drawingContext, xAxisPen, xAxisPen.Thickness, points.ToArray());
x = startX;
var rectWidth = 85;
var rectHeight = 0D;
for (int i = 0; i < SeriesArray.Count(); i++)
{
formattedText = GetFormattedText(SeriesArray.ToList()[i].Key);
drawingContext.DrawText(formattedText, new Point(x + 120 / 2 - formattedText.Width / 2, y + 4));
var _value = SeriesArray.ToList()[i].Value;
//rectHeight = _value * 200;
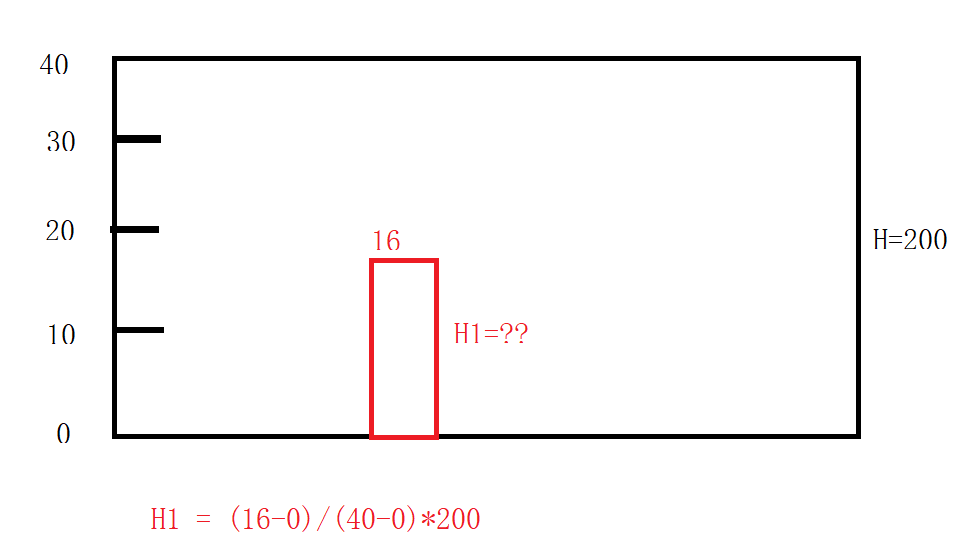
rectHeight = (_value - 0) / (stratNum - 0) * (80 * max);
//rectHeight = (stratNum - _value) / 100 * stratNum;
drawingContext.DrawRectangle(rectBrush, null, new Rect(x + (120 - 85) / 2, h - rectHeight, rectWidth, rectHeight));
x = x + 120;
}
}
FormattedText GetFormattedText(string text)
{
var brushConverter = new BrushConverter();
return new FormattedText(
text,
CultureInfo.CurrentCulture,
FlowDirection.LeftToRight,
new Typeface(new FontFamily("Microsoft YaHei"), FontStyles.Normal, FontWeights.UltraLight, FontStretches.Normal),
12, (Brush)brushConverter.ConvertFromString("#6E7079"))
{
MaxLineCount = 1,
TextAlignment = TextAlignment.Justify,
Trimming = TextTrimming.CharacterEllipsis
};
}
}
public static class SnapDrawingExtensions
{
public static void DrawSnappedLinesBetweenPoints(this DrawingContext dc,
Pen pen, double lineThickness, params Point[] points)
{
var guidelineSet = new GuidelineSet();
foreach (var point in points)
{
guidelineSet.GuidelinesX.Add(point.X);
guidelineSet.GuidelinesY.Add(point.Y);
}
var half = lineThickness / 2;
points = points.Select(p => new Point(p.X + half, p.Y + half)).ToArray();
dc.PushGuidelineSet(guidelineSet);
for (var i = 0; i < points.Length - 1; i = i + 2)
{
dc.DrawLine(pen, points[i], points[i + 1]);
}
dc.Pop();
}
}
}
如何换算出统计条占比如下:
二、创建BasicBarChartExample.xaml代码如下
<UserControl x:Class="WPFDevelopers.Samples.ExampleViews.BasicBarChartExample"
             xmlns="http://schemas.microsoft.com/winfx/2006/xaml/presentation"
             xmlns:x="http://schemas.microsoft.com/winfx/2006/xaml"
             xmlns:mc="http://schemas.openxmlformats.org/markup-compatibility/2006"
             xmlns:d="http://schemas.microsoft.com/expression/blend/2008"
             xmlns:local="clr-namespace:WPFDevelopers.Samples.ExampleViews"
             xmlns:wpfdev="https://github.com/yanjinhuagood/WPFDevelopers"
             mc:Ignorable="d"
             d:DesignHeight="450" d:DesignWidth="800">
    <Grid Background="Gainsboro">
        <Border
            Height="500"
            Background="White"
            Margin="30,0">
            <Grid Margin="20,10">

                <Grid.RowDefinitions>
                    <RowDefinition Height="40" />
                    <RowDefinition />
                    <RowDefinition Height="auto" />
                </Grid.RowDefinitions>
                <WrapPanel HorizontalAlignment="Right">
                    <Rectangle
                        Width="6"
                        Height="26"
                        Fill="Black" />
                    <TextBlock
                        Padding="10,0"
                        FontSize="24"
                        FontWeight="Black"
                        Text="{Binding KeyBarChart, RelativeSource={RelativeSource AncestorType=local:BasicBarChartExample}}" />
                </WrapPanel>
                <wpfdev:BasicBarChart
                     Grid.Row="1"
                    SeriesArray="{Binding SeriesModels, RelativeSource={RelativeSource AncestorType=local:BasicBarChartExample}}"/>
                <Button
                    Grid.Row="2"
                    Width="200"
                    VerticalAlignment="Bottom"
                    Click="Button_Click"
                    Content="刷新"
                    Style="{StaticResource PrimaryButton}" />
            </Grid>
        </Border>
    </Grid>
</UserControl>
三、创建BasicBarChartExample.xaml.cs代码如下
using System;
using System.Collections.Generic;
using System.Linq;
using System.Text;
using System.Windows;
using System.Windows.Controls;
using System.Windows.Data;
using System.Windows.Documents;
using System.Windows.Input;
using System.Windows.Media;
using System.Windows.Media.Imaging;
using System.Windows.Navigation;
using System.Windows.Shapes;

namespace WPFDevelopers.Samples.ExampleViews
{
    /// <summary>
    /// BasicBarChartExample.xaml 的交互逻辑
    /// </summary>
    public partial class BasicBarChartExample : UserControl
    {
        public IEnumerable<KeyValuePair<string, double>> SeriesModels
        {
            get { return (IEnumerable<KeyValuePair<string, double>>)GetValue(SeriesModelsProperty); }
            set { SetValue(SeriesModelsProperty, value); }
        }

        public static readonly DependencyProperty SeriesModelsProperty =
            DependencyProperty.Register("SeriesModels", typeof(IEnumerable<KeyValuePair<string, double>>), typeof(BasicBarChartExample), new PropertyMetadata(null));

        Dictionary<string, IEnumerable<KeyValuePair<string, double>>> keyValues = new Dictionary<string, IEnumerable<KeyValuePair<string, double>>>();
        public string KeyBarChart
        {
            get { return (string)GetValue(KeyBarChartProperty); }
            set { SetValue(KeyBarChartProperty, value); }
        }
        public static readonly DependencyProperty KeyBarChartProperty =
     DependencyProperty.Register("KeyBarChart", typeof(string), typeof(BasicBarChartExample), new PropertyMetadata(null));
        private int _index = 0;
        public BasicBarChartExample()
        {
            InitializeComponent();
            var Models1 = new[]
            {
                new KeyValuePair<string, double>("Mon", 120),
                new KeyValuePair<string, double>("Tue", 130),
                new KeyValuePair<string, double>("Wed", 160),
                new KeyValuePair<string, double>("Thu", 140),
                new KeyValuePair<string, double>("Fri", 200) ,
                new KeyValuePair<string, double>("Sat", 80) ,
                new KeyValuePair<string, double>("Sun", 90) ,
            };
            keyValues.Add("到访数", Models1);
            var Models2 = new[]
            {
                new KeyValuePair<string, double>("蛐蛐", 120),
                new KeyValuePair<string, double>("常威", 170),
                new KeyValuePair<string, double>("来福", 30),
                new KeyValuePair<string, double>("包龙星", 200),
                new KeyValuePair<string, double>("包有为", 100) ,
                new KeyValuePair<string, double>("雷豹", 180) ,
                new KeyValuePair<string, double>("方唐镜", 90) ,
            };
            keyValues.Add("能力值", Models2);

            SeriesModels = keyValues.ToList()[0].Value;
            KeyBarChart = keyValues.ToList()[0].Key;
        }

        private void Button_Click(object sender, RoutedEventArgs e)
        {
            _index++;
            if (_index >= keyValues.Count)
            {
                _index = 0;
            }
            SeriesModels = keyValues.ToList()[_index].Value;
            KeyBarChart = keyValues.ToList()[_index].Key;
        }
    }
}
效果预览
以上就是WPF实现绘制统计图(柱状图)的方法详解的详细内容,更多关于WPF统计图的资料请关注我们其它相关文章!
相关推荐
-

WPF开发之利用DrawingVisual绘制高性能曲线图
前言 项目中涉及到了心率检测,而且数据量达到了百万级别,通过WPF实现大数据曲线图时,尝试过最基础的Canvas来实现,但是性能堪忧,而且全部画出来也不实际.同时也尝试过找第三方的开源库,但是因为曲线图涉及到很多细节功能,第三方的肯定也没法满足.没办法,只能自己实现,上网查找后发现DrawingVisual这个玩意可以实现高性能画图,同时再搭配局部显示,这样就能实现自己想要的效果.话不多说,今天把大致的实现思路写一下,就不直接把项目的源码贴出来,写个简单的Demo就好了. 正文 1.首先新建个项
-
WPF 自定义雷达图开发实例教程
自定义雷达图表如下: 1.创建UserControl,名为"RadarChartControl" 前台: <UserControl x:Class="WpfApplication2.RadarChartControl" xmlns="http://schemas.microsoft.com/winfx/2006/xaml/presentation" xmlns:x="http://schemas.microsoft.com/win
-
WPF使用DrawingContext实现二维绘图
DrawingContext比较类似WinForm中的Graphics 类,是基础的绘图对象,用于绘制各种图形,它主要API有如下几种: 绘图API 绘图API一般形为DrawingXXX系列,常用的基础的绘图API有: DrawEllipse DrawGeometry DrawGlyphRun DrawImage DrawRectangle DrawRoundedRectangle 这些和GDI的API是非常相似的,WPF的API中另外还都有一个带动画的版本,不过一般很少用. 另外还有两个相对
-
WPF实现雷达扫描图的绘制详解
目录 前言 制作思路 具体实现 前言 实现一个雷达扫描图. 源代码在TK_King/雷达 (gitee.com),自行下载就好了 制作思路 绘制圆形(或者称之轮) 绘制分割线 绘制扫描范围 添加扫描点 具体实现 首先我们使用自定义的控件.你可以使用vs自动添加,也可以手动创建类.注意手动创建时要创建Themes/Generic.xaml的文件路径哦. 控件继承自itemscontrol,取名叫做Radar. 我们第一步思考如何实现圆形或者轮,特别是等距的轮. 我们可以使用简单的itemscont
-
WPF实现绘制统计图(柱状图)的方法详解
目录 前言 实现代码 效果预览 前言 有小伙伴提出需要实现统计图. 由于在WPF中没有现成的统计图控件,所以我们自己实现一个. PS:有更好的方式欢迎推荐. 实现代码 一.创建 BasicBarChart.cs 继承 Control代码如下. BasicBarChart.cs实现思路如下 1.SeriesArray :存放展示集合 . 2.重写OnRender . 3.先绘制X轴线. 4.调用GetFormattedText()绘制底部类别. 5.调用GetFormattedText()绘制左侧
-
C#绘制实时曲线图的方法详解
在终端机器上的曲线显示本打算用控件,可控件折腾好长时间也没弄顺,还是自己写的好使,记录下来后面再改进. //绘图部分的定义 Int32 Draw_Top;//绘画Y起点 Int32 Draw_Left;//绘画X起点 Int32 Draw_EdgeWidth;//X边缘宽度 Int32 Draw_EdgeHeight;//Y边缘高度 Int32 Draw_RangeWidth;//绘画范围宽度 Int32 Draw_RangeHeight;//绘画范围高度 Double[] XTDYData =
-
Matlab绘制雨云图的方法详解
目录 介绍 横向雨云图 纵向雨云图 介绍 写了俩代码模板,用来绘制横向云雨图与纵向云雨图,云雨图其实就是用把小提琴图拆开来的模板,想获取小提琴图绘制函数的可以看这里:基于Matlab绘制小提琴图的示例代码 后面的俩模板用的时候只需要换换数据,颜色及每一类名称即可,雨云图绘制效果如下: 横向雨云图 function rainCloudsTMPL1 % @author: slandarer % 在这里放入你的数据============================================
-
Python+NumPy绘制常见曲线的方法详解
目录 一.利萨茹曲线 二.计算斐波那契数列 三.方波 四.锯齿波和三角波 在NumPy中,所有的标准三角函数如sin.cos.tan等均有对应的通用函数. 一.利萨茹曲线 (Lissajous curve)利萨茹曲线是一种很有趣的使用三角函数的方式(示波器上显示出利萨茹曲线).利萨茹曲线由以下参数方程定义: x = A sin(at + n/2) y = B sin(bt) 利萨茹曲线的参数包括 A . B . a 和 b .为简单起见,我们令 A 和 B 均为1,设置的参数为 a=9 , b=
-
Python+matplotlib绘制多子图的方法详解
目录 本文速览 1.matplotlib.pyplot api 方式添加子图 2.面向对象方式添加子图 3.matplotlib.pyplot add_subplot方式添加子图 4.matplotlib.gridspec.GridSpec方式添加子图 5.子图中绘制子图 6.任意位置绘制子图(plt.axes) 本文速览 matplotlib.pyplot api 绘制子图 面向对象方式绘制子图 matplotlib.gridspec.GridSpec绘制子图 任意位置添加子图 关于pyplo
-
D3.js实现柱状图的方法详解
D3.js介绍 D3.js 是一个基于数据操作文档JavaScript库.D3帮助你给数据带来活力通过使用HTML.SVG和CSS.D3重视Web标准为你提供现代浏览器的全部功能,而不是给你一个专有的框架.结合强大的可视化组件和数据驱动方式Dom操作.这里也可以看到它是用SVG来呈现图表的,所以使用D3.js是需要一定的SVG基础的. 如何用D3.js实现柱状图? 柱状图里面有坐标轴和柱子.然而我们还需要SVG画布来画这些东西.先把大概的画图框架搭起来,代码如下(请注意此时我在body标签里添加
-
WPF通过线程使用ProcessBar的方法详解
前言 WPF下使用进度条也是非常方便的,如果直接采用循环然后给ProcessBar赋值,理论上是没有问题的,不过这样会卡主主UI线程,我们看到的效果等全部都结束循环后才出现最后的值. 所以需要采用线程或者后台方式给进度条赋值的方式,以下通过线程来触发事件触发的方式来实现给进度条赋值.这样就可以模拟我们在实际过程中处理数据的一种进度方式. 方法示例: using System; using System.Collections.Generic; using System.Linq; using S
-
在WPF中实现平滑滚动的方法详解
WPF实现滚动条还是比较方便的,只要在控件外围加上ScrollViewer即可,但美中不足的是:滚动的时候没有动画效果.在滚动的时候添加过渡动画能给我们的软件增色不少,例如Office 2013的滚动的时候支持动画看起来就舒服多了. 之前倒是研究过如何实现这个平滑滚动,不过网上的方案大部分大多数如下: 通过VisualTree找到ScrollViewer 在ScrollChanged事件中添加动画 这种方案效果并不好,以为我们的滚动很多时候都是一口气滚动好几格滚轮的,这个时候上一个动画还没有结束
-
python绘制棉棒图的方法详解
目录 案例 参数 总结 用法: matplotlib.pyplot.stem(*args, linefmt=None, markerfmt=None, basefmt=None, bottom=0, label=None, use_line_collection=True, orientation='vertical', data=None) 参数说明 参数 *args x,y,x—棉棒的x轴基线的取值范围,y—棉棒的长度 linefmt 棉棒的样式,{‘-’,’–’,’:’,’-.’},包
-
D3.js实现折线图的方法详解
前言 D3.js是一个帮助开发者操纵基于数据的文档的JavaScript类库,在<D3.js实现柱状图的方法详解>中已经给大家介绍过如何用D3.js来实现一个简单的柱状图了,今天我们来学习用D3.js来实现折线图,感兴趣的朋友们下面来一起看看吧. 折线图由坐标轴.线条和点组成.和实现柱状图一样,我们还是先把大概的画图框架搭起来,代码如下(别忘了添加D3.js): <!DOCTYPE html> <html lang="en"> <head>