Python matplotlib图例放在外侧保存时显示不完整问题解决
上次说到的,使用如下代码保存矢量图时,放在外侧的图例往往显示不完整:
import numpy as np
import matplotlib.pyplot as plt
fig, ax = plt.subplots()
x1 = np.random.uniform(-10, 10, size=20)
x2 = np.random.uniform(-10, 10, size=20)
#print(x1)
#print(x2)
number = []
x11 = []
x12 = []
for i in range(20):
  number.append(i+1)
  x11.append(i+1)
  x12.append(i+1)
plt.figure(1)
# you can specify the marker size two ways directly:
plt.plot(number, x1, 'bo', markersize=20,label='a') # blue circle with size 20
plt.plot(number, x2, 'ro', ms=10,label='b') # ms is just an alias for markersize

lgnd=plt.legend(bbox_to_anchor=(1.05, 1), loc=2, borderaxespad=0,numpoints=1,fontsize=10)
lgnd.legendHandles[0]._legmarker.set_markersize(16)
lgnd.legendHandles[1]._legmarker.set_markersize(10)

plt.show()

fig.savefig('scatter.png',dpi=600)
保存为scatter.png之后的效果为:
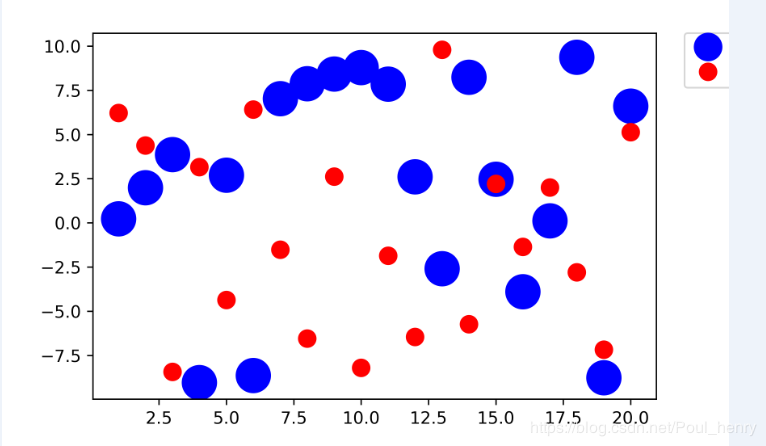
可以看到放在图像右上的图例只显示了左边一小部分。
这里的原因很简单,使用savefig()函数进行保存矢量图时,它是通过一个bounding box (bbox, 边界框),进行范围的框定,只将落入该框中的图像进行保存,如果图例没有完全落在该框中,自然不能被保存。
懂得了其原理,再进行解决问题就比较简单了。
这里有两个解决思想:
1. 将没有完全落入该bbox的图像,通过移动的方法,使其完全落入该框中,那么bbox截取的图像即是完整的 (将图像移入bbox中);
2. 改变bbox的大小,使其完全包含该图像,尤其是往往落入bbox外侧的图例 (将bbox扩大到完全包含图像)。
下面分别介绍基于这两个思想解决这个问题的两种方法:
1. 利用函数subplots_adjust()
在该官方文档中可以看到,subplots_adjust()函数的作用是调整子图布局,它包含6个参数,其中4个参数left, right, bottom, top的作用是分别调整子图的左部,右部,底部,顶部的位置,另外2个参数wspace, hspace的作用分别是调整子图之间的左右之间距离和上下之间距离。
其默认数值分别为:

以上述图为例,现考虑既然图例右侧没有显示,则调整subplots_adjust()函数的right参数,使其位置稍往左移,将参数right默认的数值0.9改为0.8,那么可以得到一个完整的图例:
import numpy as np
import matplotlib.pyplot as plt
fig, ax = plt.subplots()
x1 = np.random.uniform(-10, 10, size=20)
x2 = np.random.uniform(-10, 10, size=20)
#print(x1)
#print(x2)
number = []
x11 = []
x12 = []
for i in range(20):
  number.append(i+1)
  x11.append(i+1)
  x12.append(i+1)
plt.figure(1)
# you can specify the marker size two ways directly:
plt.plot(number, x1, 'bo', markersize=20,label='a') # blue circle with size 20
plt.plot(number, x2, 'ro', ms=10,label='b') # ms is just an alias for markersize

lgnd=plt.legend(bbox_to_anchor=(1.05, 1), loc=2, borderaxespad=0,numpoints=1,fontsize=10)
lgnd.legendHandles[0]._legmarker.set_markersize(16)
lgnd.legendHandles[1]._legmarker.set_markersize(10)

fig.subplots_adjust(right=0.8)

plt.show()

fig.savefig('scatter1.png',dpi=600)
保存为scatter1.png之后和scatter.png的对比效果为:
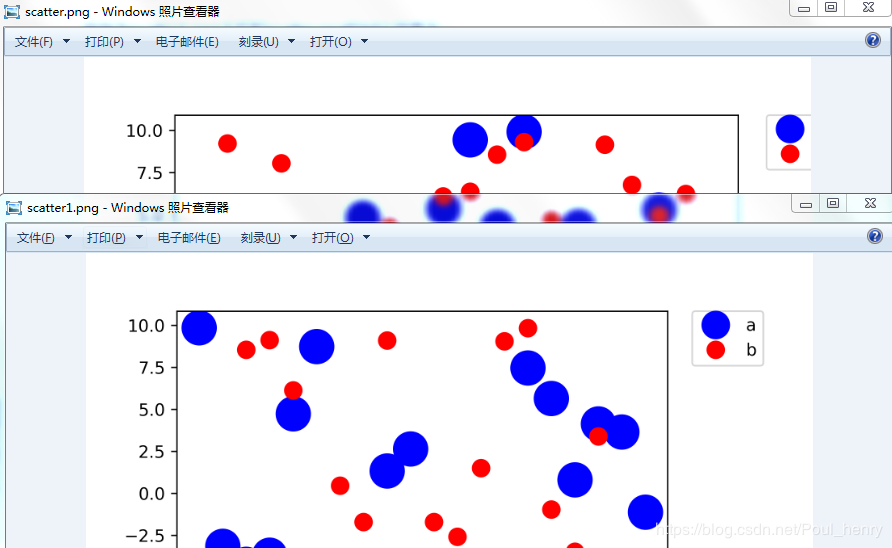
可以看到这时scatter1.png的图例显示完整,它是通过图像的右侧位置向左移动而被整体包含在保存的图像中完成的。
同理,若legend的位置在图像下侧,使用savefig()保存时也是不完整的,这时需要修改的是函数subplots_adjust()的参数bottom,使其向上移,而被包含在截取图像进行保存的框中,即下文介绍的bbox。
import numpy as np
import matplotlib.pyplot as plt
fig, ax = plt.subplots()
x1 = np.random.uniform(-10, 10, size=20)
x2 = np.random.uniform(-10, 10, size=20)
#print(x1)
#print(x2)
number = []
x11 = []
x12 = []
for i in range(20):
  number.append(i+1)
  x11.append(i+1)
  x12.append(i+1)
plt.figure(1)
# you can specify the marker size two ways directly:
plt.plot(number, x1, 'bo', markersize=20,label='a') # blue circle with size 20
plt.plot(number, x2, 'ro', ms=10,label='b') # ms is just an alias for markersize

lgnd=plt.legend(bbox_to_anchor=(0.4, -0.1), loc=2, borderaxespad=0,numpoints=1,fontsize=10)
lgnd.legendHandles[0]._legmarker.set_markersize(16)
lgnd.legendHandles[1]._legmarker.set_markersize(10)

plt.show()
fig.savefig('scatter#1.png',dpi=600)
由于subplots_adjust()中默认的bottom值为0.1,故添加fig.subplots_adjust(bottom=0.2),使其底部上移,修改为
import numpy as np
import matplotlib.pyplot as plt
fig, ax = plt.subplots()
x1 = np.random.uniform(-10, 10, size=20)
x2 = np.random.uniform(-10, 10, size=20)
#print(x1)
#print(x2)
number = []
x11 = []
x12 = []
for i in range(20):
  number.append(i+1)
  x11.append(i+1)
  x12.append(i+1)
plt.figure(1)
# you can specify the marker size two ways directly:
plt.plot(number, x1, 'bo', markersize=20,label='a') # blue circle with size 20
plt.plot(number, x2, 'ro', ms=10,label='b') # ms is just an alias for markersize

lgnd=plt.legend(bbox_to_anchor=(0.4, -0.1), loc=2, borderaxespad=0,numpoints=1,fontsize=10)
lgnd.legendHandles[0]._legmarker.set_markersize(16)
lgnd.legendHandles[1]._legmarker.set_markersize(10)

fig.subplots_adjust(bottom=0.2)

plt.show()
fig.savefig('scatter#1.png',dpi=600)
效果对比:
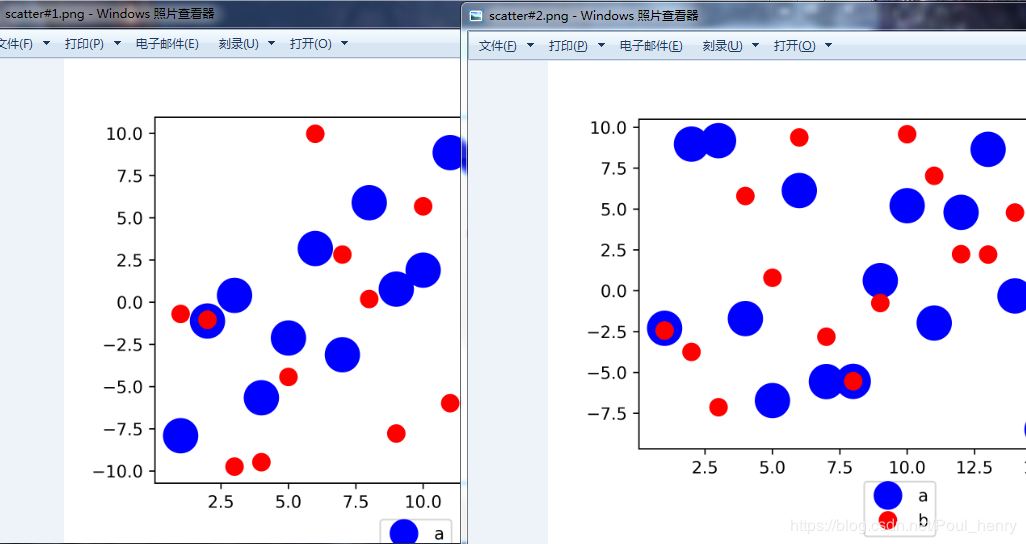
图例legend在其它位置同理。
2. 利用函数savefig()
上个博客讲到,使用savefig()函数中的三个参数fname, dpi, format可用以保存矢量图,现用该函数中另一个参数bbox_inches使
未保存到图中的图例包含进来。
下图可以看到,bbox_inches的作用是调整图的bbox, 即bounding box(边界框)
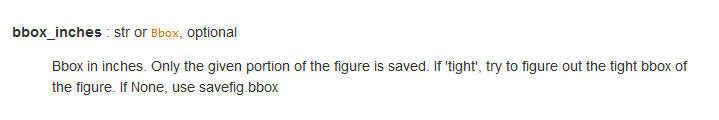
可以看到,当bbox_inches设为'tight'时,它会计算出距该图像的较紧(tight)边界框bbox,并将该选中的框中的图像保存。
这里的较紧的边界框应该是指完全包含该图像的一个矩形,但和图像有一定的填充距离,和Minimum bounding box(最小边界框),个人认为,有一定区别。单位同样是英寸(inch)。
这样图例就会被bbox包含进去,进而被保存。
完整代码:
import numpy as np
import matplotlib.pyplot as plt
fig, ax = plt.subplots()
x1 = np.random.uniform(-10, 10, size=20)
x2 = np.random.uniform(-10, 10, size=20)
#print(x1)
#print(x2)
number = []
x11 = []
x12 = []
for i in range(20):
  number.append(i+1)
  x11.append(i+1)
  x12.append(i+1)
plt.figure(1)
# you can specify the marker size two ways directly:
plt.plot(number, x1, 'bo', markersize=20,label='a') # blue circle with size 20
plt.plot(number, x2, 'ro', ms=10,label='b') # ms is just an alias for markersize

lgnd=plt.legend(bbox_to_anchor=(1.05, 1), loc=2, borderaxespad=0,numpoints=1,fontsize=10)
lgnd.legendHandles[0]._legmarker.set_markersize(16)
lgnd.legendHandles[1]._legmarker.set_markersize(10)

#fig.subplots_adjust(right=0.8)

plt.show()

fig.savefig('scatter2.png',dpi=600,bbox_inches='tight')
保存为scatter2.png,下面是scatter.png, scatter1.png, scatter2.png三张图的对比:

可以看到,scatter1.png,即第1种方法的思想,是将图像的右侧边界向左移动,截取该图用以保存的bbox未变;而scatter2.png,即第2种方法的思想,是直接将截取该图用以保存的bbox扩大为整个图像,而将其全部包括。
注:savefig()还有两个参数需要说明
其中一个是pad_inches,它的作用是当前面的bbox_inches为'tight'时,调整图像和bbox之间的填充距离,这里不需要设置,只要选择默认值即可。
个人认为,如果设置pad_inches参数为0,即pad_inches=0,截取图进行保存的bbox就是minimum bounding box (最小边界框)。
另外一个是bbox_extra_artists,它的作用是计算图像的bbox时,将其它的元素也包含进去。

这里举个例子,如果在图像左侧再加一个文本框text,保存图像时希望该文本框包含在bbox中,则可以使用该参数bbox_extra_artists将text包含进去(实际使用中,即使未使用bbox_extra_artists,保存的图像也包含该text):
import numpy as np
import matplotlib.pyplot as plt
fig, ax = plt.subplots()
x1 = np.random.uniform(-10, 10, size=20)
x2 = np.random.uniform(-10, 10, size=20)
#print(x1)
#print(x2)
number = []
x11 = []
x12 = []
for i in range(20):
  number.append(i+1)
  x11.append(i+1)
  x12.append(i+1)
plt.figure(1)
# you can specify the marker size two ways directly:
plt.plot(number, x1, 'bo', markersize=20,label='a') # blue circle with size 20
plt.plot(number, x2, 'ro', ms=10,label='b') # ms is just an alias for markersize

lgnd=plt.legend(bbox_to_anchor=(1.05, 1), loc=2, borderaxespad=0,numpoints=1,fontsize=10)
lgnd.legendHandles[0]._legmarker.set_markersize(16)
lgnd.legendHandles[1]._legmarker.set_markersize(10)

text = ax.text(-0.3,1, "test", transform=ax.transAxes)

#fig.subplots_adjust(right=0.8)
plt.show()
fig.savefig('scatter3.png',dpi=600, bbox_extra_artists=(lgnd,text),bbox_inches='tight')
显示效果:

为防止有的元素没有被包含在bbox中,可以考虑使用该参数
到此这篇关于Python matplotlib图例放在外侧保存时显示不完整问题解决的文章就介绍到这了,更多相关matplotlib外侧保存显示不完整内容请搜索我们以前的文章或继续浏览下面的相关文章希望大家以后多多支持我们!
相关推荐
-
Python如何读取、写入CSV数据
问题 你想读写一个CSV格式的文件. 解决方案 对于大多数的CSV格式的数据读写问题,都可以使用 csv 库..例如,假设你在一个名叫stocks.csv文件中有一些股票市场数据,就像这样: 下面向你展示如何将这些数据读取为一个元组的序列: import csv with open('stocks.csv') as f: f_csv = csv.reader(f) headers = next(f_csv) for row in f_csv: # Process row ... 在上面的代码中,
-
Python 合并拼接字符串的方法
问题 你想将几个小的字符串合并为一个大的字符串 解决方案 如果你想要合并的字符串是在一个序列或者 iterable 中,那么最快的方式就是使用 join() 方法.比如: >>> parts = ['Is', 'Chicago', 'Not', 'Chicago?'] >>> ' '.join(parts) 'Is Chicago Not Chicago?' >>> ','.join(parts) 'Is,Chicago,Not,Chicago?' &
-
Python 如何反方向迭代一个序列
问题 你想反方向迭代一个序列 解决方案 使用内置的 reversed() 函数,比如: >>> a = [1, 2, 3, 4] >>> for x in reversed(a): ... print(x) ... 4 3 2 1 反向迭代仅仅当对象的大小可预先确定或者对象实现了 __reversed__() 的特殊方法时才能生效.如果两者都不符合,那你必须先将对象转换为一个列表才行,比如: # Print a file backwards f = open('some
-
Python把图片转化为pdf代码实例
python安装reportlab pip install reportlab -i http://pypi.douban.com/simple/ --trusted-host pypi.douban.com 代码如下 # -*- coding: utf-8 -*- from reportlab.lib.pagesizes import portrait from reportlab.pdfgen import canvas from PIL import Image def jpg_to_pd
-
Python Matplotlib简易教程(小白教程)
简单演示 import matplotlib.pyplot as plt import numpy as np # 从[-1,1]中等距去50个数作为x的取值 x = np.linspace(-1, 1, 50) print(x) y = 2*x + 1 # 第一个是横坐标的值,第二个是纵坐标的值 plt.plot(x, y) # 必要方法,用于将设置好的figure对象显示出来 plt.show() import matplotlib.pyplot as plt import numpy as
-
关于python3.7安装matplotlib始终无法成功的问题的解决
相信很多新手(包括我自己)在安装完python3.7后需要安装matplotlib进行数据可视化时总是遇到安装不了的问题,以下简述自己安装时出现的问题. 1.安装了pycharm后无法通过setting中直接安装 这个问题出现在公司中安装pycharm后安装matplotlib的时候,具体不知道是不是网络做了限制,因为在自己家里就是能正确安装的,如果不行就多试几次 2.直接下载对应的whl包安装: http://mirrors.aliyun.com/pypi/simple/matplotlib/
-
Python 在函数上添加包装器
问题 你想在函数上添加一个包装器,增加额外的操作处理(比如日志.计时等). 解决方案 如果你想使用额外的代码包装一个函数,可以定义一个装饰器函数,例如: import time from functools import wraps def timethis(func): ''' Decorator that reports the execution time. ''' @wraps(func) def wrapper(*args, **kwargs): start = time.time()
-
Python如何读取、写入JSON数据
问题 你想读写JSON(JavaScript Object Notation)编码格式的数据. 解决方案 json 模块提供了一种很简单的方式来编码和解码JSON数据.其中两个主要的函数是 json.dumps() 和 json.loads() ,要比其他序列化函数库如pickle的接口少得多.下面演示如何将一个Python数据结构转换为JSON: import json data = { 'name' : 'ACME', 'shares' : 100, 'price' : 542.23 } j
-
Python matplotlib图例放在外侧保存时显示不完整问题解决
上次说到的,使用如下代码保存矢量图时,放在外侧的图例往往显示不完整: import numpy as np import matplotlib.pyplot as plt fig, ax = plt.subplots() x1 = np.random.uniform(-10, 10, size=20) x2 = np.random.uniform(-10, 10, size=20) #print(x1) #print(x2) number = [] x11 = [] x12 = [] for i
-

python Matplotlib底图中鼠标滑过显示隐藏内容的实例代码
在使用Matplotlib画图过程中,有些内容必须鼠标点击或者划过才可以显示,这个问题可以依赖于annotate(s='str' ,xy=(x,y) ,xytext=(l1,l2) ,..)这个函数,其中s 为注释文本内容 , xy 为被注释的坐标点, xytext 为注释文字的坐标位置,其他参数可自行百度哈.当鼠标滑过时候,将其设置为可见,默认情况下为隐藏.下面是一个小例子: # -*- coding: UTF-8 -*- import matplotlib.pyplot as plt fig
-
python matplotlib画图时坐标轴重叠显示不全和图片保存时不完整的问题解决
目录 问题 解决方案 保存时图片不完整的问题 补充:使用matplotlib时如何让坐标轴完整显示所有的标签刻度 总结 问题 在使用matplotlib作图的时候,有的时候会遇到画图时坐标轴重叠,显示不全和图片保存时不完整的问题.如下: 解决方案 画图时重叠或者显示不全的问题 画图时加上参数设置tight_layout=True 画完所有子图后,设置plt.tight_layout() # 加上tight_layout=True 参数设置 fig, axes = plt.subplots(nro
-
完美解决Python matplotlib绘图时汉字显示不正常的问题
Matplotlib是一个很好的作图软件,但是python下默认不支持中文,所以需要做一些修改,方法如下: 1.在python安装目录的Lib目录下创建ch.py文件. 文件中代码为: 保存,以后通过以下代码调用: #-*-coding:utf-8-*- #文件名: ch.py def set_ch(): from pylab import mpl mpl.rcParams['font.sans-serif'] = ['FangSong'] # 指定默认字体 mpl.rcParams['axes
-
python使用matplotlib的savefig保存时图片保存不完整的问题
python使用matplotlib的savefig保存时图片保存不完整的问题 使用如下形式的代码进行图片保存时,保存的图片出现不完整的情况,如图1所示. plt.colorbar() plt.savefig(title) plt.show() 一开始我以为是图片大小比例不对,因而通过以下代码进行修改: plt.figure(figsize=(10,8)) 但是无论怎么修改,始终会出现这种情况,要么是下面显示不完全,要么就是左边显示不完全.这是为什么呢? 这是因为colorbar会占据右边位置,
-
Python matplotlib画图时图例说明(legend)放到图像外侧详解
用python的matplotlib画图时,往往需要加图例说明.如果不设置任何参数,默认是加到图像的内侧的最佳位置. import matplotlib.pyplot as plt import numpy as np x = np.arange(10) fig = plt.figure() ax = plt.subplot(111) for i in xrange(5): ax.plot(x, i * x, label='$y = %ix$' % i) plt.legend() plt.sho
-
使用Python matplotlib作图时,设置横纵坐标轴数值以百分比(%)显示
一.当我们用Python matplot时作图时,一些数据需要以百分比显示,以更方便地对比模型的性能提升百分比. 二.借助matplotlib.ticker.FuncFormatter(),将坐标轴格式化. 例子: # encoding=utf-8 import matplotlib.pyplot as plt from matplotlib.ticker import FuncFormatter plt.rcParams['font.family'] = ['Times New Roman']
-
python matplotlib实现将图例放在图外
关于matplotlib如何设置图例的位置?如何将图例放在图外?以及如何在一幅图有多个子图的情况下,删除重复的图例?我用一个简单的例子说明一下. import pandas as pd import numpy as np import matplotlib.pyplot as plt fig = plt.figure(1) ax1 = fig.add_subplot(2,2,1) ax2 = fig.add_subplot(2,2,2) ax3 = fig.add_subplot(2,2,3)
-
python matplotlib中文显示参数设置解析
最近在学习python著名的绘图包matplotlib时发现,有时候图例等设置无法正常显示中文,于是就想把这个问题解决了. PS:本文仅针对Windows,其他平台仅供参考. 原因 大致就是matplotlib库中没有中文字体. 我安装的anaconda,这是对应的matplotlib的字体所在文件夹(怎么找到matplotlib配置文件夹所在,下面解决方案会叙述,easyman~). C:\Anaconda64\Lib\site-packages\matplotlib\mpl-data\fon
-
解决Linux系统中python matplotlib画图的中文显示问题
最近想学习一些python数据分析的内容,就弄了个爬虫爬取了一些数据,并打算用Anaconda一套的工具(pandas, numpy, scipy, matplotlib, jupyter)等进行一些初步的数据挖掘和分析. 在使用matplotlib画图时,横坐标为中文,但是画出的条形图横坐标总是显示"框框",就去查资料解决.感觉这应该是个比较常见的问题,网上的中文资料也确实很多,但是没有任何一个彻底解决了我遇到的问题.零零碎碎用了快3个小时的时间,才终于搞定.特此分享,希望能帮到有同