关于python中plt.hist参数的使用详解
如下所示:
 matplotlib.pyplot.hist(
  x, bins=10, range=None, normed=False,
  weights=None, cumulative=False, bottom=None,
  histtype=u'bar', align=u'mid', orientation=u'vertical',
  rwidth=None, log=False, color=None, label=None, stacked=False,
  hold=None, **kwargs)
x : (n,) array or sequence of (n,) arrays
这个参数是指定每个bin(箱子)分布的数据,对应x轴
bins : integer or array_like, optional
这个参数指定bin(箱子)的个数,也就是总共有几条条状图
normed : boolean, optional
If True, the first element of the return tuple will be the counts normalized to form a probability density, i.e.,n/(len(x)`dbin)
这个参数指定密度,也就是每个条状图的占比例比,默认为1
color : color or array_like of colors or None, optional
这个指定条状图的颜色
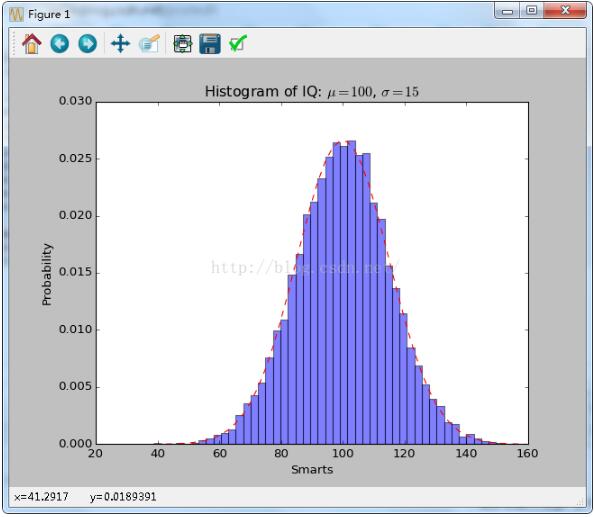
我们绘制一个10000个数据的分布条状图,共50份,以统计10000分的分布情况
  """
  Demo of the histogram (hist) function with a few features.

  In addition to the basic histogram, this demo shows a few optional features:

    * Setting the number of data bins
    * The ``normed`` flag, which normalizes bin heights so that the integral of
     the histogram is 1. The resulting histogram is a probability density.
    * Setting the face color of the bars
    * Setting the opacity (alpha value).

  """
  import numpy as np
  import matplotlib.mlab as mlab
  import matplotlib.pyplot as plt

  # example data
  mu = 100 # mean of distribution
  sigma = 15 # standard deviation of distribution
  x = mu + sigma * np.random.randn(10000)

  num_bins = 50
  # the histogram of the data
  n, bins, patches = plt.hist(x, num_bins, normed=1, facecolor='blue', alpha=0.5)
  # add a 'best fit' line
  y = mlab.normpdf(bins, mu, sigma)
  plt.plot(bins, y, 'r--')
  plt.xlabel('Smarts')
  plt.ylabel('Probability')
  plt.title(r'Histogram of IQ: $\mu=100$, $\sigma=15$')

  # Tweak spacing to prevent clipping of ylabel
  plt.subplots_adjust(left=0.15)
  plt.show()
以上这篇关于python中plt.hist参数的使用详解就是小编分享给大家的全部内容了,希望能给大家一个参考,也希望大家多多支持我们。
相关推荐
-
对Python中plt的画图函数详解
1.plt.legend plt.legend(loc=0)#显示图例的位置,自适应方式 说明: 'best' : 0, (only implemented for axes legends)(自适应方式) 'upper right' : 1, 'upper left' : 2, 'lower left' : 3, 'lower right' : 4, 'right' : 5, 'center left' : 6, 'center right' : 7, 'lower center' : 8,
-
关于python中plt.hist参数的使用详解
如下所示: matplotlib.pyplot.hist( x, bins=10, range=None, normed=False, weights=None, cumulative=False, bottom=None, histtype=u'bar', align=u'mid', orientation=u'vertical', rwidth=None, log=False, color=None, label=None, stacked=False, hold=None, **kwarg
-

Python中scatter函数参数及用法详解
最近开始学习Python编程,遇到scatter函数,感觉里面的参数不知道什么意思于是查资料,最后总结如下: 1.scatter函数原型 2.其中散点的形状参数marker如下: 3.其中颜色参数c如下: 4.基本的使用方法如下: #导入必要的模块 import numpy as np import matplotlib.pyplot as plt #产生测试数据 x = np.arange(1,10) y = x fig = plt.figure() ax1 = fig.add_subplot
-
matplotlib中plt.hist()参数解释及应用实例
目录 一.plt.hist()参数详解 二.plt.hist()简单应用 三.plt.bar()综合应用 附官方参数解释 一.plt.hist()参数详解 简介:plt.hist():直方图,一种特殊的柱状图.将统计值的范围分段,即将整个值的范围分成一系列间隔,然后计算每个间隔中有多少值.直方图也可以被归一化以显示“相对”频率. 然后,它显示了属于几个类别中的每个类别的占比,其高度总和等于1. import matplotlib as mpl import matplotlib.pyplot a
-
基于python中staticmethod和classmethod的区别(详解)
例子 class A(object): def foo(self,x): print "executing foo(%s,%s)"%(self,x) @classmethod def class_foo(cls,x): print "executing class_foo(%s,%s)"%(cls,x) @staticmethod def static_foo(x): print "executing static_foo(%s)"%x a=A(
-
python中import reload __import__的区别详解
import 作用:导入/引入一个python标准模块,其中包括.py文件.带有__init__.py文件的目录(自定义模块). import module_name[,module1,...] from module import *|child[,child1,...] 注意:多次重复使用import语句时,不会重新加载被指定的模块,只是把对该模块的内存地址给引用到本地变量环境. 实例: pythontab.py #!/usr/bin/env python #encoding: utf-8
-
Python中index()和seek()的用法(详解)
1.index() 一般用处是在序列中检索参数并返回第一次出现的索引,没找到就会报错,比如: >>> t=tuple('Allen') >>> t ('A', 'l', 'l', 'e', 'n') >>> t.index('a') Traceback (most recent call last): File "<pyshell#2>", line 1, in <module> t.index('a') V
-
对python中的argv和argc使用详解
主要问题 为什么argv中第一个,即index=0的内容就是文件名? python中argc是用什么实现的? 概念解释 argc:argument counter,命令行参数个数 argv:argument vector,命令行参数向量(内容) 通过代码理解含义 创建一个文件arg_exam.py,其中内容如下: # argv import sys for i in sys.argv: print i # argc argc = len(sys.argv) print argc 在shell中运
-
对Python中画图时候的线类型详解
在Python中用matplotlib画图的时候,为了区分曲线的类型,给曲线上面加一些标识或者颜色.以下是颜色和标识的汇总. 颜色(color 简写为 c): 蓝色: 'b' (blue) 绿色: 'g' (green) 红色: 'r' (red) 蓝绿色(墨绿色): 'c' (cyan) 红紫色(洋红): 'm' (magenta) 黄色: 'y' (yellow) 黑色: 'k' (black) 白色: 'w' (white) 灰度表示: e.g. 0.75 ([0,1]内任意浮点数) RG
-
python中强大的format函数实例详解
python中format函数用于字符串的格式化 自python2.6开始,新增了一种格式化字符串的函数str.format(),此函数可以快速处理各种字符串. 语法 它通过{}和:来代替%. 请看下面的示例,基本上总结了format函数在python的中所有用法 #通过位置 print '{0},{1}'.format('chuhao',20) print '{},{}'.format('chuhao',20) print '{1},{0},{1}'.format('chuhao',20) #
-
对Python中gensim库word2vec的使用详解
pip install gensim安装好库后,即可导入使用: 1.训练模型定义 from gensim.models import Word2Vec model = Word2Vec(sentences, sg=1, size=100, window=5, min_count=5, negative=3, sample=0.001, hs=1, workers=4) 参数解释: 1.sg=1是skip-gram算法,对低频词敏感:默认sg=0为CBOW算法. 2.size是输出词向量的维数,值