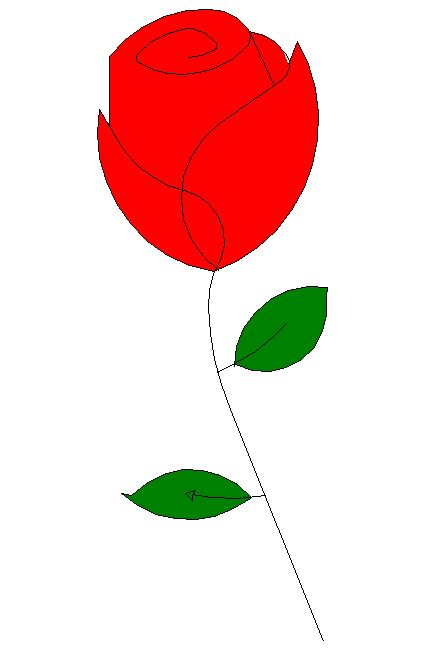
教你使用python画一朵花送女朋友
本文实例为大家分享了用python画一朵花的具体代码,供大家参考,具体内容如下
第一种,画法

from turtle import *
import time

setup(600,800,0,0)
speed(0)
penup()
seth(90)
fd(340)
seth(0)
pendown()

speed(5)
begin_fill()
fillcolor('red')
circle(50,30)

for i in range(10):
  fd(1)
  left(10)

circle(40,40)

for i in range(6):
  fd(1)
  left(3)

circle(80,40)

for i in range(20):
  fd(0.5)
  left(5)

circle(80,45)

for i in range(10):
  fd(2)
  left(1)

circle(80,25)

for i in range(20):
  fd(1)
  left(4)

circle(50,50)

time.sleep(0.1)

circle(120,55)

speed(0)

seth(-90)
fd(70)

right(150)
fd(20)

left(140)
circle(140,90)

left(30)
circle(160,100)

left(130)
fd(25)

penup()
right(150)
circle(40,80)
pendown()

left(115)
fd(60)

penup()
left(180)
fd(60)
pendown()

end_fill()

right(120)
circle(-50,50)
circle(-20,90)

speed(1)
fd(75)

speed(0)
circle(90,110)

penup()
left(162)
fd(185)
left(170)
pendown()
circle(200,10)
circle(100,40)
circle(-52,115)
left(20)
circle(100,20)
circle(300,20)
speed(1)
fd(250)

penup()
speed(0)
left(180)
fd(250)
circle(-300,7)
right(80)
circle(200,5)
pendown()

left(60)
begin_fill()
fillcolor('green')
circle(-80,100)
right(90)
fd(10)
left(20)
circle(-63,127)
end_fill()

penup()
left(50)
fd(20)
left(180)

pendown()
circle(200,25)

penup()
right(150)

fd(180)

right(40)
pendown()
begin_fill()
fillcolor('green')
circle(-100,80)
right(150)
fd(10)
left(60)
circle(-80,98)
end_fill()

penup()
left(60)
fd(13)
left(180)

pendown()
speed(1)
circle(-200,23)

exitonclick()
第二种,画法

import turtle
import math

def p_line(t, n, length, angle):
  """Draws n line segments."""
  for i in range(n):
    t.fd(length)
    t.lt(angle)

def polygon(t, n, length):
  """Draws a polygon with n sides."""
  angle = 360 / n
  p_line(t, n, length, angle)

def arc(t, r, angle):
  """Draws an arc with the given radius and angle."""
  arc_length = 2 * math.pi * r * abs(angle) / 360
  n = int(arc_length / 4) + 1
  step_length = arc_length / n
  step_angle = float(angle) / n

  # Before starting reduces, making a slight left turn.
  t.lt(step_angle / 2)
  p_line(t, n, step_length, step_angle)
  t.rt(step_angle / 2)

def petal(t, r, angle):
  """Draws a 花瓣 using two arcs."""
  for i in range(2):
    arc(t, r, angle)
    t.lt(180 - angle)

def flower(t, n, r, angle, p):
  """Draws a flower with n petals."""
  for i in range(n):
    petal(t, r, angle)
    t.lt(p / n)

def leaf(t, r, angle, p):
  """Draws a 叶子 and fill it."""
  t.begin_fill() # Begin the fill process.
  t.down()
  flower(t, 1, r, angle, p)
  t.end_fill()

def main():
  window = turtle.Screen() # creat a screen
  window.bgcolor("white")
  window.title("draw a flower")
  lucy = turtle.Turtle()
  lucy.shape("turtle")
  lucy.color("red")
  lucy.width(3)
  # lucy.speed(10)

  # Drawing flower
  flower(lucy, 7, 60, 100, 360)

  # Drawing pedicel
  lucy.color("brown")
  lucy.rt(90)
  lucy.fd(200)

  # Drawing leaf 1
  lucy.width(1)
  lucy.rt(270)
  lucy.color("green")
  leaf(lucy, 40, 80, 180)
  lucy.rt(140)
  lucy.color("black")
  lucy.fd(30)
  lucy.lt(180)
  lucy.fd(30)

  # Drawing leaf 2
  lucy.rt(120)
  lucy.color("green")
  leaf(lucy, 40, 80, 180)
  lucy.color("black")
  lucy.rt(140)
  lucy.fd(30)
  lucy.ht() # hideturtle
  window.exitonclick()

main()
以上就是本文的全部内容,希望对大家的学习有所帮助,也希望大家多多支持我们。
您可能感兴趣的文章:
- 使用Python编写简单的画图板程序的示例教程
- python使用reportlab画图示例(含中文汉字)
- Python实现在matplotlib中两个坐标轴之间画一条直线光标的方法
- python计算圆周长、面积、球体体积并画出圆
- Python使用turtule画五角星的方法
- Python画图学习入门教程
- 利用python画一颗心的方法示例
- 跟老齐学Python之画圈还不简单吗?
- Python学习之用pygal画世界地图实例
- Python3使用PyQt5制作简单的画板/手写板实例
赞 (0)

