在Python中用GDAL实现矢量对栅格的切割实例
概述:
本文讲述如何在Python中用GDAL实现根据输入矢量边界对栅格数据的裁剪。
效果:

裁剪前

矢量边界
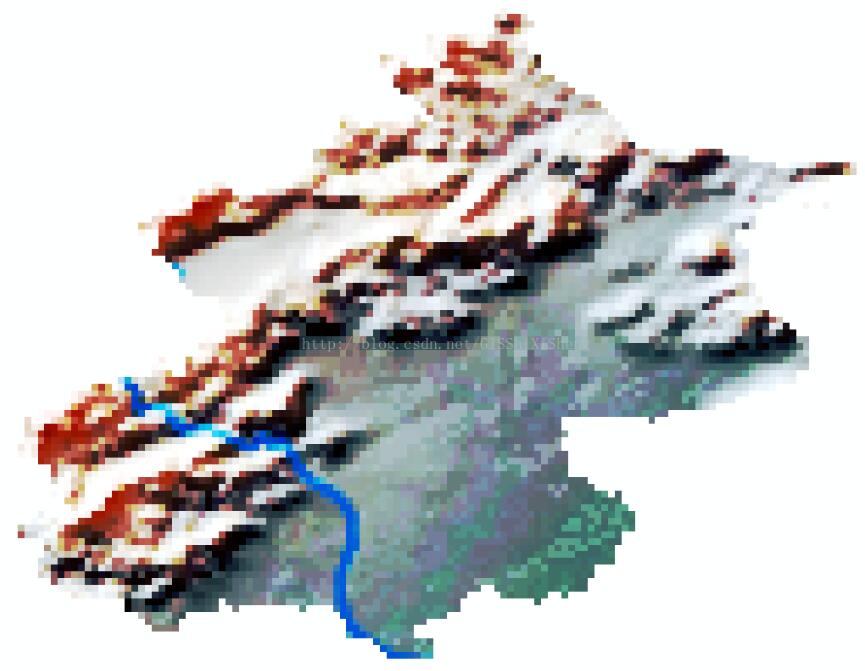
裁剪后
实现代码:
# -*- coding: utf-8 -*-
"""
@author lzugis
@date 2017-06-02
@brief 利用shp裁剪影像
"""

from osgeo import gdal, gdalnumeric, ogr
from PIL import Image, ImageDraw
import os
import operator

gdal.UseExceptions()

# This function will convert the rasterized clipper shapefile
# to a mask for use within GDAL.
def imageToArray(i):
 """
 Converts a Python Imaging Library array to a
 gdalnumeric image.
 """
 a=gdalnumeric.fromstring(i.tobytes(),'b')
 a.shape=i.im.size[1], i.im.size[0]
 return a

def arrayToImage(a):
 """
 Converts a gdalnumeric array to a
 Python Imaging Library Image.
 """
 i=Image.frombytes('L',(a.shape[1],a.shape[0]),
   (a.astype('b')).tobytes())
 return i

def world2Pixel(geoMatrix, x, y):
 """
 Uses a gdal geomatrix (gdal.GetGeoTransform()) to calculate
 the pixel location of a geospatial coordinate
 """
 ulX = geoMatrix[0]
 ulY = geoMatrix[3]
 xDist = geoMatrix[1]
 pixel = int((x - ulX) / xDist)
 line = int((ulY - y) / xDist)
 return (pixel, line)

#
# EDIT: this is basically an overloaded
# version of the gdal_array.OpenArray passing in xoff, yoff explicitly
# so we can pass these params off to CopyDatasetInfo
#
def OpenArray( array, prototype_ds = None, xoff=0, yoff=0 ):
 ds = gdal.Open( gdalnumeric.GetArrayFilename(array) )

 if ds is not None and prototype_ds is not None:
  if type(prototype_ds).__name__ == 'str':
   prototype_ds = gdal.Open( prototype_ds )
  if prototype_ds is not None:
   gdalnumeric.CopyDatasetInfo( prototype_ds, ds, xoff=xoff, yoff=yoff )
 return ds

def histogram(a, bins=range(0,256)):
 """
 Histogram function for multi-dimensional array.
 a = array
 bins = range of numbers to match
 """
 fa = a.flat
 n = gdalnumeric.searchsorted(gdalnumeric.sort(fa), bins)
 n = gdalnumeric.concatenate([n, [len(fa)]])
 hist = n[1:]-n[:-1]
 return hist

def stretch(a):
 """
 Performs a histogram stretch on a gdalnumeric array image.
 """
 hist = histogram(a)
 im = arrayToImage(a)
 lut = []
 for b in range(0, len(hist), 256):
  # step size
  step = reduce(operator.add, hist[b:b+256]) / 255
  # create equalization lookup table
  n = 0
  for i in range(256):
   lut.append(n / step)
   n = n + hist[i+b]
  im = im.point(lut)
 return imageToArray(im)

def main( shapefile_path, raster_path ):
 # Load the source data as a gdalnumeric array
 srcArray = gdalnumeric.LoadFile(raster_path)

 # Also load as a gdal image to get geotransform
 # (world file) info
 srcImage = gdal.Open(raster_path)
 geoTrans = srcImage.GetGeoTransform()

 # Create an OGR layer from a boundary shapefile
 shapef = ogr.Open(shapefile_path)
 lyr = shapef.GetLayer( os.path.split( os.path.splitext( shapefile_path )[0] )[1] )
 poly = lyr.GetNextFeature()

 # Convert the layer extent to image pixel coordinates
 minX, maxX, minY, maxY = lyr.GetExtent()
 ulX, ulY = world2Pixel(geoTrans, minX, maxY)
 lrX, lrY = world2Pixel(geoTrans, maxX, minY)

 # Calculate the pixel size of the new image
 pxWidth = int(lrX - ulX)
 pxHeight = int(lrY - ulY)

 clip = srcArray[:, ulY:lrY, ulX:lrX]

 #
 # EDIT: create pixel offset to pass to new image Projection info
 #
 xoffset = ulX
 yoffset = ulY
 print "Xoffset, Yoffset = ( %f, %f )" % ( xoffset, yoffset )

 # Create a new geomatrix for the image
 geoTrans = list(geoTrans)
 geoTrans[0] = minX
 geoTrans[3] = maxY

 # Map points to pixels for drawing the
 # boundary on a blank 8-bit,
 # black and white, mask image.
 points = []
 pixels = []
 geom = poly.GetGeometryRef()
 pts = geom.GetGeometryRef(0)
 for p in range(pts.GetPointCount()):
  points.append((pts.GetX(p), pts.GetY(p)))
 for p in points:
  pixels.append(world2Pixel(geoTrans, p[0], p[1]))
 rasterPoly = Image.new("L", (pxWidth, pxHeight), 1)
 rasterize = ImageDraw.Draw(rasterPoly)
 rasterize.polygon(pixels, 0)
 mask = imageToArray(rasterPoly)

 # Clip the image using the mask
 clip = gdalnumeric.choose(mask, \
  (clip, 0)).astype(gdalnumeric.uint8)

 # This image has 3 bands so we stretch each one to make them
 # visually brighter
 for i in range(3):
  clip[i,:,:] = stretch(clip[i,:,:])

 # Save new tiff
 #
 # EDIT: instead of SaveArray, let's break all the
 # SaveArray steps out more explicity so
 # we can overwrite the offset of the destination
 # raster
 #
 ### the old way using SaveArray
 #
 # gdalnumeric.SaveArray(clip, "OUTPUT.tif", format="GTiff", prototype=raster_path)
 #
 ###
 #
 gtiffDriver = gdal.GetDriverByName( 'GTiff' )
 if gtiffDriver is None:
  raise ValueError("Can't find GeoTiff Driver")
 gtiffDriver.CreateCopy( "beijing.tif",
  OpenArray( clip, prototype_ds=raster_path, xoff=xoffset, yoff=yoffset )
 )

 # Save as an 8-bit jpeg for an easy, quick preview
 clip = clip.astype(gdalnumeric.uint8)
 gdalnumeric.SaveArray(clip, "beijing.jpg", format="JPEG")

 gdal.ErrorReset()

if __name__ == '__main__':
 #shapefile_path, raster_path
 shapefile_path = 'beijing.shp'
 raster_path = 'world.tif'
 main( shapefile_path, raster_path )
补充知识:Python+GDAL | 读取矢量并写出txt
这篇文章主要描述了如何使用GDAL/OGR打开矢量文件、读取属性表,并将部分属性写出至txt。
代码
import ogr,sys,os
import numpy as np

os.chdir(r'E:\')

#设置driver,并打开矢量文件
driver = ogr.GetDriverByName('ESRI Shapefile')
ds = driver.Open('sites.shp', 0)
if ds is None:
  print("Could not open", 'sites.shp')
  sys.exit(1)
#获取图册
layer = ds.GetLayer()

#要素数量
numFeatures = layer.GetFeatureCount()
print("Feature count: "+str(numFeatures))

#获取范围
extent = layer.GetExtent()
print("Extent:", extent)
print("UL:", extent[0],extent[3])
print("LR:", extent[1],extent[2])

#获取要素
feature = layer.GetNextFeature()
ids = []
xs = []
ys = []
covers = []
#循环每个要素属性
while feature:
  #获取字段“id”的属性
  id = feature.GetField('id')
  #获取空间属性
  geometry = feature.GetGeometryRef()
  x = geometry.GetX()
  y = geometry.GetY()
  cover = feature.GetField('cover')
  ids.append(id)
  xs.append(x)
  ys.append(y)
  covers.append(cover)
  feature = layer.GetNextFeature()

data = [ids, xs, ys, covers]
data = np.array(data)
data = data.transpose()

#写出致txt
np.savetxt('myfile.txt',data, fmt='%s %s %s %s')
np.savetxt('myfile.csv',data, fmt='%s %s %s %s')

#释放文件空间
layer.ResetReading()
feature.Destroy()
ds.Destroy()
以上这篇在Python中用GDAL实现矢量对栅格的切割实例就是小编分享给大家的全部内容了,希望能给大家一个参考,也希望大家多多支持我们。
相关推荐
-
python+gdal+遥感图像拼接(mosaic)的实例
作为摄影测量与遥感的从业者,笔者最近开始深入研究gdal,为工作打基础!个人觉得gdal也是没有什么技术含量,调用别人的api.但是想想这也是算法应用的一个技能,多学无害! 关于遥感图像的镶嵌,主要分为6大步骤: step1: 1)对于每一幅图像,计算其行与列: 2)获取左上角X,Y 3)获取像素宽和像素高 4)计算max X 和 min Y,切记像素高是负值 maxX1 = minX1 + (cols1 * pixelWidth) minY1 = maxY1 + (rows1 * pixelH
-
python使用gdal对shp读取,新建和更新的实例
昨天要处理一个shp文件,读取里面的信息,做个计算然后写到后面新建的field里面.先写个外面网上都能找到的新建和读取吧. 1.读取shp文件 #-*- coding: cp936 -*- try: from osgeo import gdal from osgeo import ogr exceptImportError: import gdal import ogr defReadVectorFile(): # 为了支持中文路径,请添加下面这句代码 gdal.SetConfigOption(
-
GDAL 矢量属性数据修改方式(python)
Case:需要给一个现有的shp数据创建一个字段,并将属性表中原有的一个文本类型的属性转换为整型后填入新创建的字段. Problem:新字段创建成功,但是赋值操作无效,即无法成功给字段写入值. solution:对字段进行赋值后需要,重新写入Feature,否则赋值无效,即layer0.SetFeature(feature). 特别注意:在对数据进行读写操作,一定要以读写的方式打开,即Open(filePath,1),该方法的原型为Open(pszName,int bUpdate = false
-
在Python中用GDAL实现矢量对栅格的切割实例
概述: 本文讲述如何在Python中用GDAL实现根据输入矢量边界对栅格数据的裁剪. 效果: 裁剪前 矢量边界 裁剪后 实现代码: # -*- coding: utf-8 -*- """ @author lzugis @date 2017-06-02 @brief 利用shp裁剪影像 """ from osgeo import gdal, gdalnumeric, ogr from PIL import Image, ImageDraw impo
-
Python通过OpenCV的findContours获取轮廓并切割实例
1 获取轮廓 OpenCV2获取轮廓主要是用cv2.findContours import numpy as np import cv2 im = cv2.imread('test.jpg') imgray = cv2.cvtColor(im,cv2.COLOR_BGR2GRAY) ret,thresh = cv2.threshold(imgray,127,255,0) image, contours, hierarchy = cv2.findContours(thresh,cv2.RETR_T
-

python 使用GDAL实现栅格tif转矢量shp的方式小结
前言 目前有一张tif格式的栅格影像,需要在web地图上进行展示,使用动态切片WMS的方式,渲染速度比较慢,而且大的时候会出现模糊的问题.并且后面需要做多期影像的切换,渲染与加载效率也值得关注. 计划是使用栅格转矢量的方式,将栅格数据转为矢量shp文件,然后进行矢量切片,使用Mapbox进行前端动态渲染.在网上查询了很多资料,有人说使用d3-contour在node.js中生成或者使用rasterio在python中进行转换,整体过程都比较麻烦,很不易实现.最终选定了使用GDAL进行栅格转矢量的
-
Anaconda下Python中GDAL模块的下载与安装过程
本文介绍在Anaconda环境下,安装Python中栅格.矢量等地理数据处理库GDAL的方法. 需要注意的是,本文介绍基于conda install命令直接联网安装GDAL库的方法:这一方法有时不太稳定,且速度较慢.因此,如果有需要,大家可以参考Anaconda环境GDAL库基于whl文件的配置方法(https://www.jb51.net/article/280638.htm)这篇文章中的方法,可以更快速地配置GDAL库. 首先,我们打开“Anaconda Prompt (Anaconda)”
-
使用Python和GDAL给图片加坐标系的实现思路(坐标投影转换)
** 使用Python和GDAL给图片加坐标系 ** 假设你已经知道arcgis地理配准(如下图内容),懂一点python. ** -目的和背景 1.从地图网站获得一张PNG格式的截图,已知坐标系为WGS84和左上角坐标.arcgis地理配准再定义投影即可给它加上原图的坐标系. 2.假设有上千张图片,可用Python和GDAL给图片加坐标系. -实现思路 1.使用GDAL需要知道待投影图片的地理坐标信息.仿射矩阵参数. 仿射矩阵参数是干什么的?见:https://zhuanlan.zhihu.c
-
浅谈Python中用datetime包进行对时间的一些操作
1. 计算给出两个时间之间的时间差 import datetime as dt # current time cur_time = dt.datetime.today() # one day pre_time = dt.date(2016, 5, 20) # eg: 2016.5.20 delta = cur_time - pre_time # if you want to get discrepancy in days print delta.days # if you want to get
-
解决python中用matplotlib画多幅图时出现图形部分重叠的问题
1.解决方法:使用函数 tight_layout() 2.具体使用方法 import matplotlib.pyplot as plt fig = plt.figure() ''' 具体的画图程序 ''' fig.tight_layout() fig.tight_layout() 功能:使得子图横纵坐标更加紧凑,主要用于自动调整图区的大小以及间距,使所有的绘图及其标题.坐标轴标签等都可以不重叠的完整显示在画布上. 参数: Pad:用于设置绘图区边缘与画布边缘的距离大小 w_pad:用于设置绘图区
-
在python中用print()输出多个格式化参数的方法
不废话,直接贴代码: disroot = math.sqrt(deta) root1 = (-b + disroot)/(2*a) root2 = (-b - disroot)/(2*a) print("有两个不同的解: %.2f,%.2f"%root1,%root2) 这是最初写的print()代码,不过运行时总提示TypeError 后来上网查了好多资料,发现格式根本不是这样子的,是我想当然了 disroot = math.sqrt(deta) root1 = (-b + disr
-
在python中用url_for构造URL的方法
用url_for构造URL,他接受函数名作为第一个参数,也接受对应URL规则的变量部分的命名参数,未知的变量部分会添加到URL末尾作为查询参数. 构建URL而不选择直接在代码中拼URL的原因有两点: 1)在未来有更改的时候只需要一次性修改URL,而不用到处替换: 2)URL构建会转义特殊字符和Unicode数据, 这些工作不需要我们自己处理. 下面是个例子: from flask import Flask,url_for app = Flask(__name__) @app.route('/ex