Python matplotlib之折线图的各种样式与画法总结
目录
- 1. 折线形状
- 2. 数据点形状
- 3. 折线颜色
- 4. 添加网格
- 总结

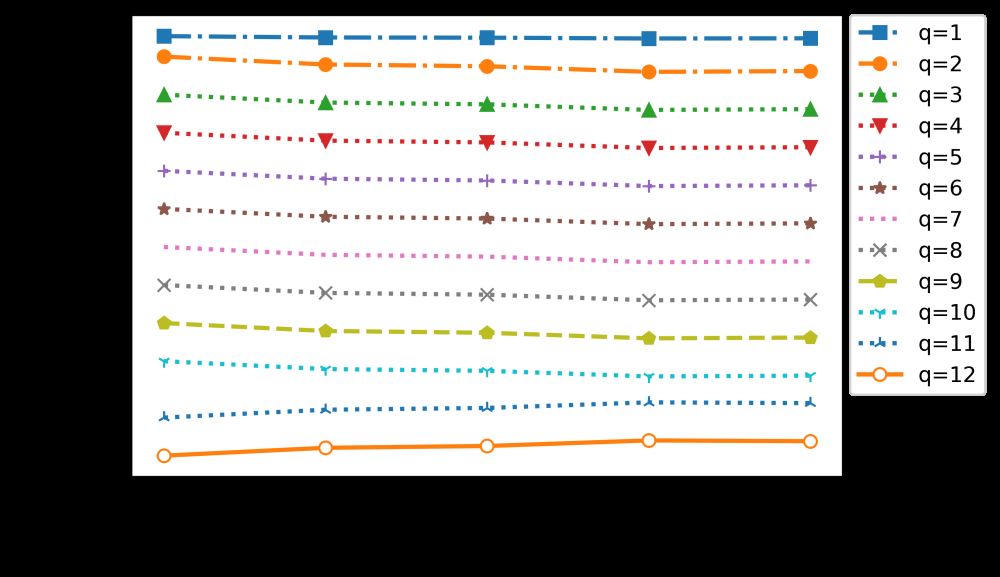
上述图的完整代码如下:
from numpy import *
import numpy as np
import pandas as pd
import matplotlib.pyplot as plt
import pylab as pl
from mpl_toolkits.axes_grid1.inset_locator import inset_axes

y1 = [0.92787363, 0.92436059, 0.92380563, 0.92169979, 0.92215771]
y2 = [0.87410227, 0.85341922, 0.84874221, 0.83406411, 0.83610876]
y3 = [0.77410227, 0.75341922, 0.74874221, 0.73406411, 0.73610876]
y4 = [0.67410227, 0.65341922, 0.64874221, 0.63406411, 0.63610876]
y5 = [0.57410227, 0.55341922, 0.54874221, 0.53406411, 0.53610876]
y6 = [0.47410227, 0.45341922, 0.44874221, 0.43406411, 0.43610876]
y7 = [0.37410227, 0.35341922, 0.34874221, 0.33406411, 0.33610876]
y8 = [0.27410227, 0.25341922, 0.24874221, 0.23406411, 0.23610876]
y9 = [0.17410227, 0.15341922, 0.14874221, 0.13406411, 0.13610876]
y10 = [0.07410227, 0.05341922, 0.04874221, 0.03406411, 0.03610876]
y11 = [-0.07410227, -0.05341922, -0.04874221, -0.03406411, -0.03610876]
y12 = [-0.17410227, -0.15341922, -0.14874221, -0.13406411, -0.13610876]

x = ['1','2','3','4','5']

plt.figure() #figsize是图片的大小`fig = plt.figure(figsize = (7,5))
ax=plt.axes()

# plt.grid(zorder=0, linewidth = "0.5", linestyle = "-.")  #显示网格,zorder控制网格显示的前后, color='#738CBC'   , color='#DFD478'

ax.plot(x, y1, marker='s', linestyle = '-.', lw=2, label='q=1') #‘s' : 方块状
ax.plot(x, y2, marker='o', linestyle = '-.', lw=2, label='q=2') #o' : 实心圆
ax.plot(x, y3, marker='^', linestyle = 'dotted', lw=2, label='q=3') #‘^' : 正三角形
ax.plot(x, y4, marker='v', linestyle = 'dotted', lw=2, label='q=4') #‘v' : 反正三角形
ax.plot(x, y5, marker='+', linestyle = 'dotted', lw=2, label='q=5') #‘+' : 加号
ax.plot(x, y6, marker='*', linestyle = 'dotted', lw=2, label='q=6') #‘*' : 星号
ax.plot(x, y7, marker=',', linestyle = 'dotted', lw=2, label='q=7') #‘,':点
ax.plot(x, y8, marker='x', linestyle = ':', lw=2, label='q=8') #‘x' : x号
ax.plot(x, y9, marker='p', linestyle = 'dashed', lw=2, label='q=9') #‘p' : 五角星
ax.plot(x, y10, marker='1', linestyle = 'dotted', lw=2, label='q=10') #‘1' : 三脚架标记
ax.plot(x, y11, marker='2', linestyle = 'dotted', lw=2, label='q=11') #‘2' : 三脚架标记
ax.plot(x, y12, marker='o', linestyle = '-', lw=2, label='q=12', markerfacecolor='white') #空心圆

plt.legend(bbox_to_anchor=(1.20, 1), loc=1, borderaxespad=0)   #显示标签,并放在外侧
plt.xlabel('p',fontsize=20) #设置y轴的标签
plt.ylabel('values',fontsize=20) #设置y轴的标签
plt.savefig("values",dpi=500, bbox_inches='tight') # 保存图片
1. 折线形状
- 直线: linestyle = ‘-’ 或 省略
- 破折线: linestyle = ‘–’ 或 linestyle = ‘dashed’
- 点划线: linestyle = ‘-.’ 或 linestyle = ‘dashdot’
- 虚线: linestyle = ‘:’ 或 linestyle = ‘dotted’
2. 数据点形状
- ‘s’ : 方块状
- ‘o’ : 实心圆
- ‘^’ : 正三角形
- ‘v’ : 反正三角形
- ‘+’ : 加号
- ‘*’ : 星号
- ‘,’:点
- ‘x’ : x号
- ‘p’ : 五角星
- ‘1’ : 三脚架标记
- ‘2’ : 三脚架标记
若是想设置空心圆则使用如下参数:
markeredgecolor # 圆边缘的颜色
markeredgewidth # 圆的线宽
ax.plot(x, y12, marker='o', linestyle = '-', lw=2, label='q=12', markerfacecolor='white') #空心圆
3. 折线颜色
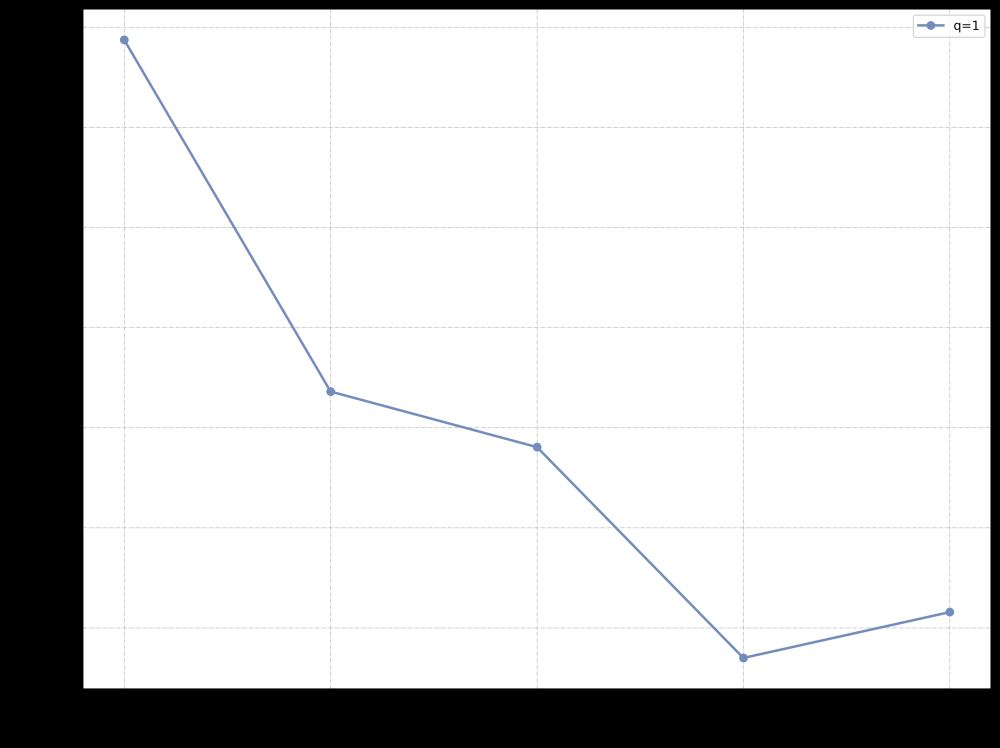
若是想修改折线的颜色,使用color:表示的折线的颜色,如:red:红色,blue:蓝色等;

y1 = [0.92787363, 0.92436059, 0.92380563, 0.92169979, 0.92215771]
x = ['1','2','3','4','5']

plt.figure(figsize = (13,10)) # 设置画布 大小为13*10
ax=plt.axes()

plt.grid(zorder=0, linewidth = "0.5", linestyle = "-.")  #显示网格,zorder控制网格显示的前后

ax.plot(x, y1, marker='o', ls='-', lw=2, label='q=1', color='#738CBC')

plt.legend()   #显示标签
plt.xlabel('p',fontsize=20)
plt.ylabel('ACC',fontsize=20)
4. 添加网格
其中,plt.grid(zorder=0, linewidth = "0.5", linestyle = "-.") #显示网格,zorder控制网格显示的前后是显示网格的语句。
- 添加网格: plt.grid()
- 只显示垂直网格线: plt.grid(axis=‘x’)
- 只显示水平网格线: plt.grid(axis=‘y’)
- 网格样式: linestyle=‘-’ 和 折线样式相同常用这四种:
- 直线: linestyle = ‘-’ 或 省略
- 破折线: linestyle = ‘–’ 或 linestyle = ‘dashed’
- 点划线: linestyle = ‘-.’ 或 linestyle = ‘dashdot’
- 虚线: linestyle = ‘:’ 或 linestyle = ‘dotted’
- 网格线宽度:linewidth=num

上述图的完整代码如下:
from matplotlib import pyplot as plt
# 添加网格
# 选择字体显示中文
plt.rcParams['font.family'] = ['Microsoft YaHei']
# 定义坐标数据
y = [0.92787363, 0.92436059, 0.92380563, 0.92169979, 0.92215771]
x = ['1','2','3','4','5']

# 第一张表
plt.subplot(2, 2, 1)
# 传入数据
plt.plot(x, y, color='#738CBC', marker='o')
# 添加标题
plt.title("第一张表,加坐标和颜色", color='blue', fontsize=10)
# 添加网格
plt.grid()

# 第二张表
plt.subplot(2, 2, 2)
plt.plot(x, y)
plt.title("垂直网格线,1宽", color='blue', fontsize=10)
plt.grid(axis='x', linewidth=1)

# 第三张表
plt.subplot(2, 2, 3)
plt.plot(x, y)
plt.title("水平网格线,破折线,0.5宽", color='blue', fontsize=10)
plt.grid(axis='y', linestyle='--', linewidth=0.5)

# 第四张表
plt.subplot(2, 2, 4)
plt.plot(x, y)
plt.title("蓝色虚线网格线", color='blue', fontsize=10)
plt.grid(color='b', linestyle=':')

# 总标题
plt.suptitle("网格对比", color='blue', fontsize=15)
plt.tight_layout()  # 自动调整子图参数,使之自动填充整个图像区域
# 绘图
plt.show()
总结
到此这篇关于Python matplotlib之折线图的各种样式与画法的文章就介绍到这了,更多相关matplotlib折线图画法内容请搜索我们以前的文章或继续浏览下面的相关文章希望大家以后多多支持我们!
赞 (0)

