修改python plot折线图的坐标轴刻度方法

修改python plot折线图的坐标轴刻度,这里修改为整数:

代码如下:

from matplotlib import pyplot as plt
import matplotlib.ticker as ticker
import numpy as np

def std_plot():
 overall_std = [34.369, 21.366, 16.516, 11.151]
 max_std = [36.769, 21.794, 14.390, 4.684]
 plt.figure()
 plt.plot(overall_std, label='average_std')

 plt.plot(max_std, label='max_std')
 plt.legend()
 plt.xlabel('window')
 plt.ylabel('std')
 plt.xticks(range(len(max_std)))
 # plt.gca().xaxis.set_major_formatter(ticker.FormatStrFormatter('%1.1f'))

 plt.show()

std_plot()

可以发现,通过上面的方法可以自定义x轴的刻度显示为其他样式,比如根据时间显示。只需要修改为:

plt.xticks(pd.date_range(‘2014-09-01','2014-09-30'),rotation=90)#设置时间标签显示格式

如果希望保留小数点后一位,可以这样:
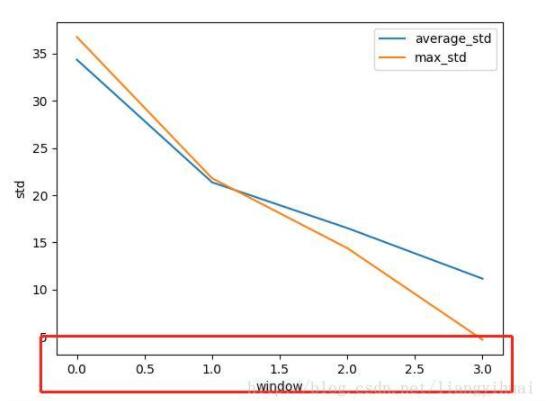
from matplotlib import pyplot as plt
import matplotlib.ticker as ticker
import numpy as np

def std_plot():
 overall_std = [34.369, 21.366, 16.516, 11.151]
 max_std = [36.769, 21.794, 14.390, 4.684]
 plt.figure()
 plt.plot(overall_std, label='average_std')

 plt.plot(max_std, label='max_std')
 plt.legend()
 plt.xlabel('window')
 plt.ylabel('std')
 # plt.xticks(range(len(max_std)))
 plt.gca().xaxis.set_major_formatter(ticker.FormatStrFormatter('%1.1f'))

 plt.show()

std_plot()

以上这篇修改python plot折线图的坐标轴刻度方法就是小编分享给大家的全部内容了,希望能给大家一个参考,也希望大家多多支持我们。

(0)

相关推荐

  • Python处理时间日期坐标轴过程详解

    1. 前言 当日期数据作为图表的坐标轴时通常需要特殊处理,应为日期字符串比较长,容易产生重叠现象 2. 设定主/次刻度 2.1 引用库 from matplotlib.dates import DateFormatter, WeekdayLocator, DayLocator, MONDAY,YEARLY 2.2 获取每月/周/日数据 获取每月一日数据 monthdays = MonthLocator() 获取每周一的日期数据 mondays = WeekdayLocator(MONDAY) #

  • Python matplotlib学习笔记之坐标轴范围

    Python学习笔记--坐标轴范围 参靠视频:<Python数据可视化分析 matplotlib教程>链接:https://www.bilibili.com/video/av6989413/?p=6 所用的库及环境: IDE:Pycharm Python环境:python3.7 Matplotlib: Matplotlib 1.11 Numpy: Numpy1.15. 坐标轴范围 概念 根据需求调整坐标轴的范围 坐标轴范围调整 第一种形式 通过plt.axis()可以查看图形的x轴的最小最大坐

  • Python使用matplotlib模块绘制图像并设置标题与坐标轴等信息示例

    本文实例讲述了Python使用matplotlib模块绘制图像并设置标题与坐标轴等信息.分享给大家供大家参考,具体如下: 进行图像绘制有时候需要设定坐标轴以及图像标题等信息,示例代码如下: #-*- coding: utf-8 -*- #!/usr/bin/python import matplotlib.pyplot as plt from numpy.random import randn x = range(100) y = randn(100) fig = plt.figure() ax

  • python使用Matplotlib改变坐标轴的默认位置

    使用Matplotlib绘制的图表的默认坐标轴是在左下角的,这样对于一些函数的显示不是非常方便,要改变坐标轴的默认显示方式主要要使用gca()方法 plt.gca()表示 Get current axis,使用这个方法我们可以获得整张图表的坐标对象,这样我们就可以对坐标进行处理了,像移动位置,设置颜色之类的,类似plt.gcf()这个是 Get current figure 即获得当前图表的图像,对图像进行处理. 我们可以定义一个变量接收这个值: ax = plt.gca() 接下来还要了解一个

  • python 设置xlabel,ylabel 坐标轴字体大小,字体类型

    本文介绍了python 设置xlabel,ylabel 坐标轴字体大小,字体类型,分享给大家,具体如下: #--coding:utf-8-- import matplotlib.pyplot as plt #数据设置 x1 =[0,5000,10000, 15000, 20000, 25000, 30000, 35000, 40000, 45000, 50000, 55000]; y1=[0, 223, 488, 673, 870, 1027, 1193, 1407, 1609, 1791, 2

  • Python利用matplotlib做图中图及次坐标轴的实例

    图中图 准备数据 import matplotlib.pyplot as plt fig = plt.figure() x = [1, 2, 3, 4, 5, 6, 7] y = [1, 3, 4, 2, 5, 8, 6] - 大图 首先确定大图左下角的位置以及宽高: 注意,4个值都是占整个figure坐标系的百分比.在这里,假设figure的大小是10x10,那么大图就被包含在由(1, 1)开始,宽8,高8的坐标系内. # below are all percentage left, bott

  • Python设置matplotlib.plot的坐标轴刻度间隔以及刻度范围

    一.用默认设置绘制折线图 import matplotlib.pyplot as plt x_values=list(range(11)) #x轴的数字是0到10这11个整数 y_values=[x**2 for x in x_values] #y轴的数字是x轴数字的平方 plt.plot(x_values,y_values,c='green') #用plot函数绘制折线图,线条颜色设置为绿色 plt.title('Squares',fontsize=24) #设置图表标题和标题字号 plt.t

  • python matplotlib绘图,修改坐标轴刻度为文字的实例

    工作中偶尔需要做客流分析,用pyplot 库绘图.一般情况下, x 轴刻度默认显示为数字. 例如: 我希望x 轴刻度显示为星期日期. 查询pyplot 文档, 发现了 xtick() 函数可以修改刻度. 代码如下: import matplotlib.pyplot as plt import numpy as np #val_ls = [np.random.randint(100) + i*20 for i in range(7)] scale_ls = range(7) index_ls =

  • 对python中Matplotlib的坐标轴的坐标区间的设定实例讲解

    如下所示: <span style="font-family: Arial, Helvetica, sans-serif;">>>> import numpy as np</span> >>> import matplotlib.pyplot as plt >>> x=np.arange(-5,5,0.01) >>> y=x**3 >>> plt.axis([-6,6,-1

  • Python绘图Matplotlib之坐标轴及刻度总结

    学习https://matplotlib.org/gallery/index.html 记录,描述不一定准确,具体请参考官网 Matplotlib使用总结图 import matplotlib.pyplot as plt plt.rcParams['font.sans-serif']=['SimHei'] # 用来正常显示中文标签 plt.rcParams['axes.unicode_minus']=False # 用来正常显示负号 import pandas as pd import nump

随机推荐