Python算法绘制特洛伊小行星群实现示例
目录
- 最小势能点
- 拉格朗日点
- 特洛伊小行星群
书接上文
用Python搓一个太阳系
你们要的3D太阳系
3体人真的存在吗
太长不看版


最小势能点
在由两个大质量物体构成的重力系统中,有一些特殊的区域会在两个天体的顶级拉扯之下达到平衡,这些点就是拉格朗日点。而所谓平衡并非受力平衡,而是要求这个区域的物体会跟着双星系统以相同的角速度运动。
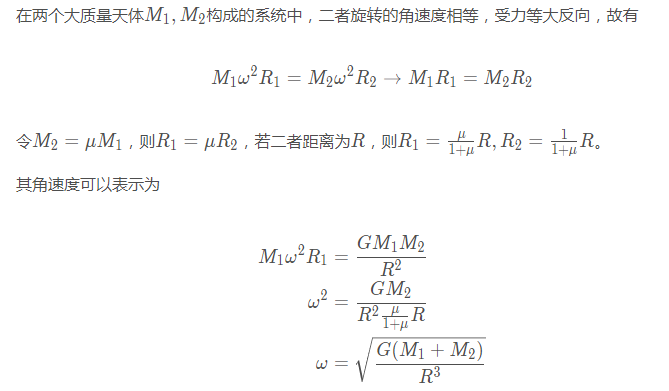
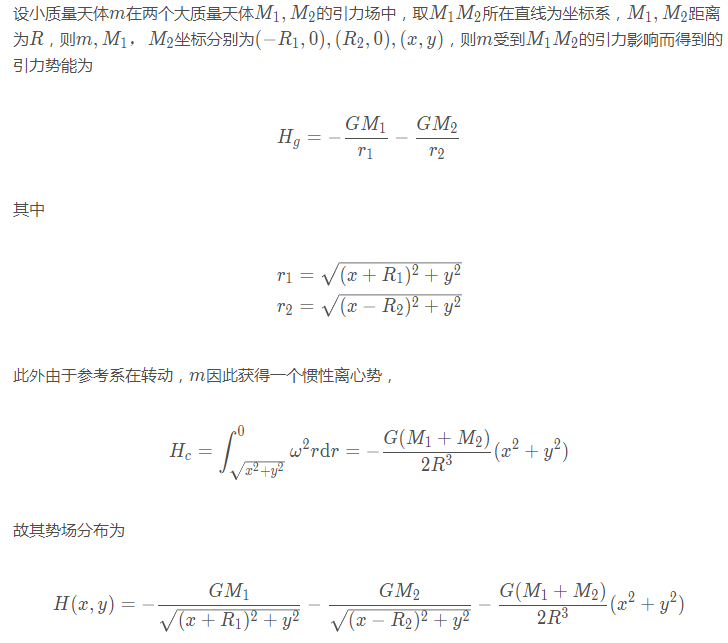
根据上帝是个胖子这个假定,状态稳定意味着低势能。所以在解析求解拉格朗日点之前,我们可以试着画出这个双星系统的势能分布。
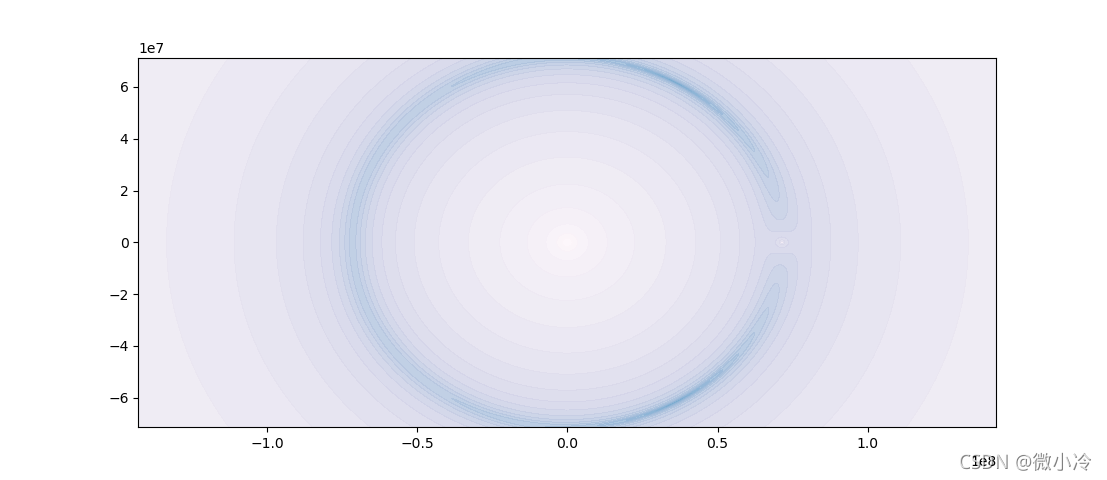
接下来搞一下太阳和木星:


可见木星在太阳的引力场下根本无法自己,但若把坐标系调整一下,会看到木星虽小,却还是有自己地盘的,毕竟也是有诸多卫星的,这就意味着木星和太阳之间必然存在一些相对平衡的位置。
为了看得更加仔细,取对数是个不错的方法
import numpy as np
import matplotlib.pyplot as plt
from matplotlib import cm,ticker
R = 7.1492e7
M1,M2 = 1.9891e30, 1.8982e27
G = 6.67e-11
mu = M2/M1
R1,R2 = np.array([mu,1])/(1+mu)*R
x,y = np.meshgrid(
    np.arange(-0.5,1.5,1e-3)*R2
   ,np.arange(-1,1,1e-3)*R2)
H = -G*M1/np.sqrt((x+R1)**2+y**2)
H -= G*M2/np.sqrt((x-R2)**2+y**2)
H -= G*(M1+M2)*(x**2+y**2)/2/R**3
absH = np.abs(H)
absH[absH>1e14] = 1e14  #去除奇点
absH -= (np.min(absH)-1)
print(np.max(absH),np.min(absH))
plt.contourf(x,y,np.log(absH),50,alpha=0.75,
    cmap=cm.PuBu_r)
plt.show()
拉格朗日点
公式预警→_→
根据刚刚的图可以看出,一般天体都会有一个属于自己的私密区域,在这个区域里,别的天体的引力作用甚微,此区域即希尔球,拉格朗日点则是两个天体希尔球的分界处。

在极坐标下,可得
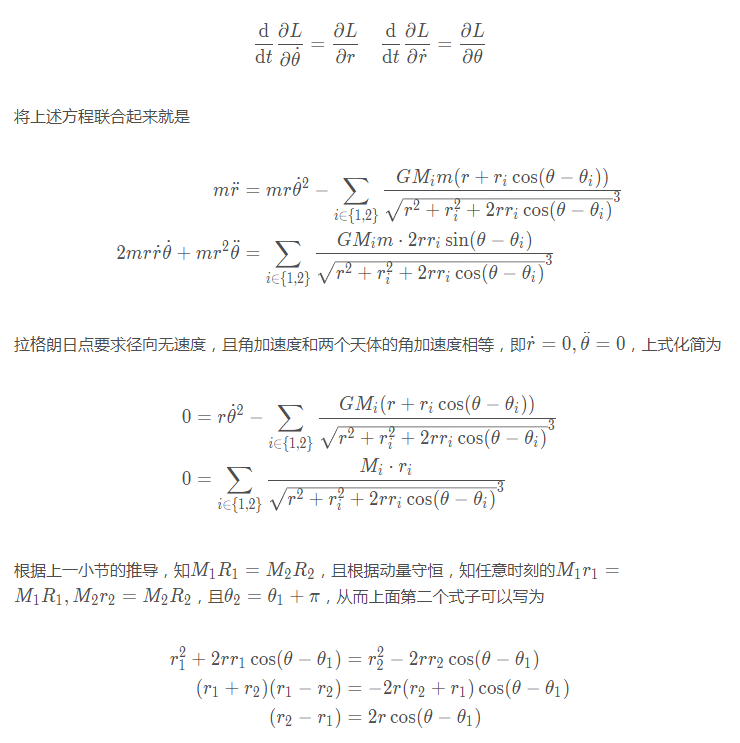


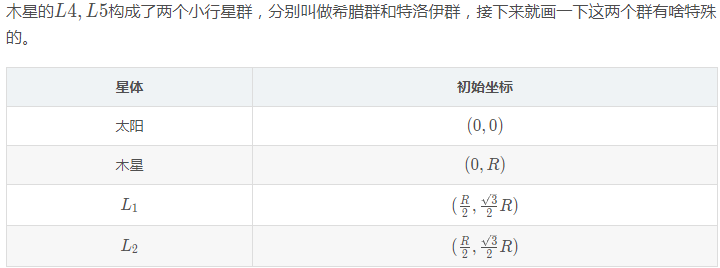
对于木星来说,五个拉格朗日点一般默认为

特洛伊小行星群
参考此前的太阳系行星位置,得到其三维图

from os import cpu_count
import numpy as np
from numpy.random import rand
import matplotlib.pyplot as plt
from matplotlib import animation
au,G,RE,ME = 1.48e11,6.67e-11,1.48e11,5.965e24
m = np.array([3.32e5,0.055,0.815,1,0.107,317.8])*ME*G
r = np.array([0,0.387,0.723,1,1.524,5.203])*RE
v = np.array([0,47.89,35.03,29.79,24.13,13.06])*1000
theta = rand(len(m))*np.pi*2
theta[-1] = 0   #木星初始角度为0
cTheta,sTheta = np.cos(theta), np.sin(theta)
xyz = r*np.array([cTheta, sTheta, 0*r])     #位置三分量
uvw = v*np.array([-sTheta, cTheta, 0*v])    #速度三分量
N_ast = 100
x_ast = xyz[0][-1]/2*(
    1+(np.random.rand(100)-0.5)*0.1)
y_ast = xyz[0][-1]/2*np.sqrt(3)*(
    1+(np.random.rand(100)-0.5)*0.1)
y_flag = np.random.rand(100)>0.5
y_ast = y_ast*(2*y_flag-1)
m_ast = rand(N_ast)*1e20
r_ast = np.sqrt(x_ast**2+y_ast**2)
v_ast = np.sqrt(G*3.32e5*ME/r_ast)  #小行星速度sqrt(GM/R)
theta = rand(N_ast)*np.pi*2
phi = (rand(N_ast)-0.5)*0.3     #给一个随机的小倾角
cTheta,sTheta = x_ast/r_ast, y_ast/r_ast
cPhi,sPhi = np.cos(phi),np.sin(phi)
xyza = np.array([x_ast, y_ast, sPhi])
uvwa = v_ast*np.array([-sTheta*cPhi, cTheta*cPhi, sPhi])
name = "solar1.gif"
fig = plt.figure(figsize=(10,10))
ax = fig.add_subplot(projection='3d')
ax.grid()
ax.set_xlim3d([-5.5*RE,5.5*RE])
ax.set_ylim3d([-5.5*RE,5.5*RE])
ax.set_zlim3d([-5.5*RE,5.5*RE])
traces = [ax.plot([],[],[],'-', lw=0.5)[0] for _ in range(len(m))]
pts = [ax.plot([],[],[],marker='o')[0] for _ in range(len(m))]
pt_asts = [ax.plot([],[],[],marker='.',lw=0.2)[0] for _ in range(N_ast)]
N = 10000
dt = 3600*50
ts =  np.arange(0,N*dt,dt)
xyzs,xyzas = [],[]
for _ in ts:
    xyz_ij = (xyz.reshape(3,1,len(m))-xyz.reshape(3,len(m),1))
    r_ij = np.sqrt(np.sum(xyz_ij**2,0))
    xyza_ij = (xyz.reshape(3,1,len(m))-xyza.reshape(3,N_ast,1))
    ra_ij = np.sqrt(np.sum(xyza_ij**2,0))
    for j in range(len(m)):
        for i in range(len(m)):
            if i!=j :
                uvw[:,i] += m[j]*xyz_ij[:,i,j]*dt/r_ij[i,j]**3
        for i in range(N_ast):
            uvwa[:,i] += m[j]*xyza_ij[:,i,j]*dt/ra_ij[i,j]**3
    xyz += uvw*dt
    xyza += uvwa*dt
    xyzs.append(xyz.tolist())
    xyzas.append(xyza.tolist())
xyzs = np.array(xyzs).transpose(2,1,0)
xyzas = np.array(xyzas).transpose(2,1,0)
def animate(n):
    for i in range(len(m)):
        xyz = xyzs[i]
        traces[i].set_data(xyz[0,:n],xyz[1,:n])
        traces[i].set_3d_properties(xyz[2,:n])
        pts[i].set_data(xyz[0,n],xyz[1,n])
        pts[i].set_3d_properties(xyz[2,n])
    for i in range(N_ast):
        pt_asts[i].set_data(xyzas[i,0,n],xyzas[i,1,n])
        pt_asts[i].set_3d_properties(xyzas[i,2,n])
    return traces+pts+pt_asts
ani = animation.FuncAnimation(fig, animate,
    range(1,N,100), interval=10, blit=True)
plt.show()
ani.save(name)
以上就是Python算法绘制特洛伊小行星群实现示例的详细内容,更多关于Python算法绘制特洛伊小行星群的资料请关注我们其它相关文章!
赞 (0)

