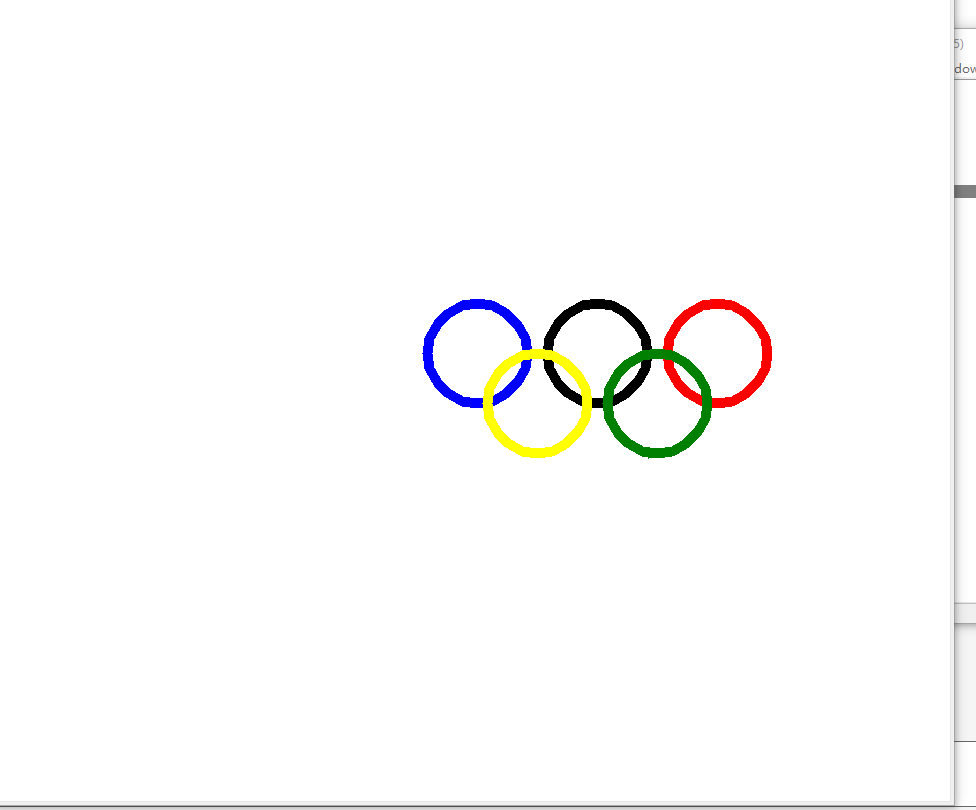
python图形绘制奥运五环实例讲解
1. 适当的空格
逻辑行首的空白表示逻辑表示层次关系 从而决定分组
语句从新行的第一列开始
风格统一 都用四个空格
不能随便加空格
奥运五环
#绘制奥运五环

import turtle
turtle.width(10)

turtle.color("blue")
turtle.circle(50)
turtle.penup()
turtle.goto(120,0)
turtle.pendown()
turtle.color("black")
turtle.circle(50)
turtle.penup()
turtle.goto(240,0)
turtle.pendown()
turtle.color("red")
turtle.circle(50)
turtle.penup()
turtle.goto(240,0)
turtle.pendown()

turtle.penup()
turtle.goto(60,-50)
turtle.pendown()
turtle.color("yellow")
turtle.circle(50)

turtle.penup()
turtle.goto(180,-50)
turtle.pendown()
turtle.color("green")
turtle.circle(50)

以上就是本次介绍的全部内容,更多相关内容在下方阅读,感谢大家对我们的支持。
相关推荐
-
Python图形绘制操作之正弦曲线实现方法分析
本文实例讲述了Python图形绘制操作之正弦曲线实现方法.分享给大家供大家参考,具体如下: 要画正弦曲线先设定一下x的取值范围,从0到2π.要用到numpy模块. numpy.pi 表示π numpy.arange( 0 , 2π ,0.01) 从0到2π,以0.01步进. 令 x=numpy.arange( 0, 2*numpy.pi, 0.01) y=numpy.sin(x) 画图要用到matplotlib.pyplot模块中plot方法. plot(x,y) pyplot.plot.sh
-
python图形绘制奥运五环实例讲解
1. 适当的空格 逻辑行首的空白表示逻辑表示层次关系 从而决定分组 语句从新行的第一列开始 风格统一 都用四个空格 不能随便加空格 奥运五环 #绘制奥运五环 import turtle turtle.width(10) turtle.color("blue") turtle.circle(50) turtle.penup() turtle.goto(120,0) turtle.pendown() turtle.color("black") turtle.circle
-
python使用turtle库绘制奥运五环
Turtle库是Python语言中一个很流行的绘制图像的函数库,想象一个小乌龟,在一个横轴为x.纵轴为y的坐标系原点,(0,0)位置开始,它根据一组函数指令的控制,在这个平面坐标系中移动,从而在它爬行的路径上绘制了图形. 效果图: #奥运五环 import turtle turtle.setup(1.0,1.0) #设置窗口大小 turtle.title("奥运五环") #蓝圆 turtle.penup() turtle.right(90) turtle.forward(-50) tu
-
用Python绘制漫步图实例讲解
我们首先来看下代码: import matplotlib.pyplot as plt from random import choice class RandomWalk(): def __init__(self,num_points=5000): self.num_points=num_points self.x_values=[0] self.y_values=[0] def fill_walk(self): while len(self.x_values)<self.num_points:
-
python绘制雷达图实例讲解
在python中,有很多用于生成基于JS的百度开源的数据可视化图表 Echarts 的类库.设置的图样都非常漂亮,小编之前研究过很多图示,用python去抓取数据,然后进行画图,经历这么多得图样,最深有感触的还是关于绘制雷达图,大家应该都遇到过需要用到雷达图的时候吧,那就一起来了解下吧. 安装模块: pip install pyecharts 导入模块: from pyecharts import options as opts 准备数据: 大家可以自行导入数据使用. 绘制雷达图: randar
-
python+matplotlib绘制3D条形图实例代码
本文分享的实例主要实现的是Python+matplotlib绘制一个有阴影和没有阴影的3D条形图,具体如下. 首先看看演示效果: 完整代码如下: import numpy as np import matplotlib.pyplot as plt from mpl_toolkits.mplot3d import Axes3D # setup the figure and axes fig = plt.figure(figsize=(8, 3)) ax1 = fig.add_subplot(121
-
python+matplotlib绘制旋转椭圆实例代码
旋转椭圆 实例代码: import matplotlib.pyplot as plt import numpy as np from matplotlib.patches import Ellipse delta = 45.0 # degrees angles = np.arange(0, 360 + delta, delta) ells = [Ellipse((1, 1), 4, 2, a) for a in angles] a = plt.subplot(111, aspect='equal
-
python+matplotlib绘制饼图散点图实例代码
本文是从matplotlib官网上摘录下来的一个实例,实现的功能是Python+matplotlib绘制自定义饼图作为散点图的标记,具体如下. 首先看下演示效果 实例代码: import numpy as np import matplotlib.pyplot as plt # first define the ratios r1 = 0.2 # 20% r2 = r1 + 0.4 # 40% # define some sizes of the scatter marker sizes = n
-
Python创建简单的神经网络实例讲解
在过去的几十年里,机器学习对世界产生了巨大的影响,而且它的普及程度似乎在不断增长.最近,越来越多的人已经熟悉了机器学习的子领域,如神经网络,这是由人类大脑启发的网络.在本文中,将介绍用于一个简单神经网络的 Python 代码,该神经网络对于一个 1x3 向量,分类第一个元素是否为 10. 步骤1: 导入 NumPy. Scikit-learn 和 Matplotlib import numpy as np from sklearn.preprocessing import MinMaxScale
-
用python画个奥运五环(附完整代码)
完整代码 #绘制奥运五环 import turtle #导入turtle包 turtle.width(15) #定义线条宽度为15 turtle.color("red") turtle.circle(50) turtle.penup() #定义颜色,园半径,抬笔 turtle.goto(120,0) turtle.pendown() #定义线条走向,落笔 turtle.color("green") turtle.circle(50) turtle.penup() t
随机推荐
- 举例简介AngularJS的内部语言环境
- Javascript 类型转换方法
- Angularjs为ng-click事件传递参数
- JavaScript 异步调用框架 (Part 5 - 链式实现)
- js实现仿爱微网两级导航菜单效果代码
- Js和JQuery获取鼠标指针坐标的实现代码分享
- Linux系统下查看mysql版本的四种方法
- php中一个有意思的日期逻辑处理
- C++你可能不知道地方小结
- 从JVM分析Java的类的加载和卸载机制
- SQL(MSSQLSERVER)服务启动错误代码3414的解决方法
- subversion服务端配置步骤详解
- jQuery代码实现图片墙自动+手动淡入淡出切换效果
- 使用滤镜设置透明导致 IE 6/7/8/9 解析异常的解决方法
- 向当前style sheet中插入一个新的style实现方法
- c++ 临时对象的来源
- php预定义常量
- php中heredoc与nowdoc介绍
- php生成EXCEL的东东
- Spring Cloud Ribbon实现客户端负载均衡的示例

