python 使用turtule绘制递归图形(螺旋、二叉树、谢尔宾斯基三角形)

插图工具使用Python内置的turtle模块,为什么叫这个turtle乌龟这个名字呢,可以这样理解,创建一个乌龟,乌龟能前进、后退、左转、右转,乌龟的尾巴朝下,它移动时就会画一条线。并且为了增加乌龟画图的艺术价值,可以改变尾巴宽度和尾巴浸入墨水的颜色。

1.递归绘制螺旋

先用我们让乌龟以line_len长度前进,然后向右旋转90°,然后缩短line_len长度递归调用draw_spiral函数

import turtle
my_turtle = turtle.Turtle()
my_win = turtle.Screen()
def draw_spiral(tur, line_len):
  if line_len > 0:
    my_turtle.forward(line_len)
    my_turtle.right(90)
    draw_spiral(tur, line_len - 1)
draw_spiral(my_turtle, 100)
my_win.exitonclick()

2.递归绘制二叉树

首先绘制branch_length长度的主干枝条,然后向右旋转20°,递归调用draw_tree绘制主干枝条上的右分支,之后再向左旋转40°(因为需要抵消右旋转的20°),递归调用draw_tree绘制主干枝条的左分支,然后再向右旋转20°,原路返回。

import turtle
my_tree = turtle.Turtle()
my_win = turtle.Screen()
def draw_tree(branch_length, t):
  if branch_length > 5:
    t.forward(branch_length)
    t.right(20)
    draw_tree(branch_length-20, t)
    t.left(40)
    draw_tree(branch_length-20, t)
    t.right(20)
    t.backward(branch_length)
my_tree.left(90)
my_tree.up() # 抬起尾巴
my_tree.backward(200)
my_tree.down() # 放下尾巴
my_tree.color('green')
draw_tree(100, my_tree)
my_win.exitonclick()

3.绘制谢尔宾斯基三角形

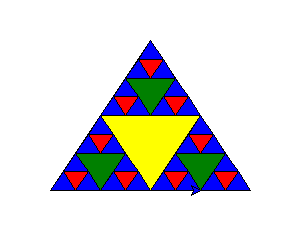
谢尔宾斯基三角形使用了三路递归算法,从一个大三角形开始,通过连接每一个边的中点,将大三角型分为四个三角形,然后忽略中间的三角形,依次对其余三个三角形执行上述操作。

import turtle
def draw_triangle(points, color, my_angle):
  my_angle.fillcolor(color)
  my_angle.up()
  my_angle.goto(points[0][0], points[0][1])
  my_angle.down()
  my_angle.begin_fill()
  my_angle.goto(points[1][0], points[1][1])
  my_angle.goto(points[2][0], points[2][1])
  my_angle.goto(points[0][0], points[0][1])
  my_angle.end_fill()
def get_mid(p1, p2):
  return ((p1[0]+p2[0])/2, (p1[1]+p2[1])/2)
def sierpinski(points, degree, my_angle):
  colormap = ['blue', 'red', 'green', 'yellow',
        'violet', 'orange', 'white']
  draw_triangle(points, colormap[degree], my_angle)
  if degree > 0:
    sierpinski([points[0],
          get_mid(points[0], points[1]),
          get_mid(points[0], points[2])],
          degree - 1, my_angle)
    sierpinski([points[1],
          get_mid(points[0], points[1]),
          get_mid(points[1], points[2])],
          degree - 1, my_angle)
    sierpinski([points[2],
          get_mid(points[2], points[1]),
          get_mid(points[0], points[2])],
          degree - 1, my_angle)
my_turtle = turtle.Turtle()
my_win = turtle.Screen()
my_points = [[-100, -50], [0, 100], [100, -50]]
sierpinski(my_points, 3, my_turtle)
my_win.exitonclick()
总结

以上所述是小编给大家介绍的python 使用turtule绘制递归图形(螺旋、二叉树、谢尔宾斯基三角形),希望对大家有所帮助,如果大家有任何疑问请给我留言,小编会及时回复大家的。在此也非常感谢大家对我们网站的支持!

(0)

相关推荐

  • Python使用turtule画五角星的方法

    本文实例讲述了Python使用turtule画五角星的方法.分享给大家供大家参考.具体实现方法如下: #!/usr/bin/env python import turtle import time turtle.forward(100) turtle.right(144) time.sleep(1) turtle.forward(100) turtle.right(144) time.sleep(1) turtle.forward(100) turtle.right(144) turtle.fo

  • python 使用turtule绘制递归图形(螺旋、二叉树、谢尔宾斯基三角形)

    插图工具使用Python内置的turtle模块,为什么叫这个turtle乌龟这个名字呢,可以这样理解,创建一个乌龟,乌龟能前进.后退.左转.右转,乌龟的尾巴朝下,它移动时就会画一条线.并且为了增加乌龟画图的艺术价值,可以改变尾巴宽度和尾巴浸入墨水的颜色. 1.递归绘制螺旋 先用我们让乌龟以line_len长度前进,然后向右旋转90°,然后缩短line_len长度递归调用draw_spiral函数 import turtle my_turtle = turtle.Turtle() my_win =

  • Python使用matplotlib绘制三维图形示例

    本文实例讲述了Python使用matplotlib绘制三维图形.分享给大家供大家参考,具体如下: 用二维泡泡图表示三维数据 泡泡的坐标2维,泡泡的大小三维,使用到的函数 plt.scatter(P[:,0], P[:,1], s=S, lw = 1.5, edgecolors = C, facecolors='None') 其中P[:,0], P[:,1]为泡泡的坐标数据,s为泡泡的大小,lw为泡泡的边线宽度,edgecolors为边线颜色,facecolors为填充颜色 代码及注释 # -*-

  • Python使用统计函数绘制简单图形实例代码

    前言 Matplotlib 是 Python 的绘图库. 它可与 NumPy 一起使用,提供了一种有效的 MatLab 开源替代方案. 它也可以和图形工具包一起使用,如 PyQt 和 wxPython. 用matplotlib绘制一些大家比较熟悉又经常混淆的统计图形,掌握这些统计图形可以对数据可视化有一个深入理解. Windows 系统安装 Matplotlib 进入到 cmd 窗口下,执行以下命令: python -m pip install -U pip setuptools python

  • Python绘制3D图形

    3D图形在数据分析.数据建模.图形和图像处理等领域中都有着广泛的应用,下面将给大家介绍一下如何使用python进行3D图形的绘制,包括3D散点.3D表面.3D轮廓.3D直线(曲线)以及3D文字等的绘制. 准备工作: python中绘制3D图形,依旧使用常用的绘图模块matplotlib,但需要安装mpl_toolkits工具包,安装方法如下:windows命令行进入到python安装目录下的Scripts文件夹下,执行: pip install --upgrade matplotlib即可:li

  • Python基于matplotlib实现绘制三维图形功能示例

    本文实例讲述了Python基于matplotlib实现绘制三维图形功能.分享给大家供大家参考,具体如下: 代码一: # coding=utf-8 import numpy as np import matplotlib.pyplot as plt import mpl_toolkits.mplot3d x,y = np.mgrid[-2:2:20j,-2:2:20j] #测试数据 z=x*np.exp(-x**2-y**2) #三维图形 ax = plt.subplot(111, project

  • Python使用matplotlib实现绘制自定义图形功能示例

    本文实例讲述了Python使用matplotlib实现绘制自定义图形功能.分享给大家供大家参考,具体如下: 一 代码 from matplotlib.path importPath from matplotlib.patches importPathPatch import matplotlib.pyplot as plt fig, ax = plt.subplots() #定义绘图指令与控制点坐标 #其中MOVETO表示将绘制起点移动到指定坐标 #CURVE4表示使用4个控制点绘制3次贝塞尔曲

  • Python使用matplotlib绘制多个图形单独显示的方法示例

    本文实例讲述了Python使用matplotlib绘制多个图形单独显示的方法.分享给大家供大家参考,具体如下: 一 代码 import numpy as np import matplotlib.pyplot as plt #创建自变量数组 x= np.linspace(0,2*np.pi,500) #创建函数值数组 y1 = np.sin(x) y2 = np.cos(x) y3 = np.sin(x*x) #创建图形 plt.figure(1) ''' 意思是在一个2行2列共4个子图的图中,

  • Python实现读取txt文件中的数据并绘制出图形操作示例

    本文实例讲述了Python实现读取txt文件中的数据并绘制出图形操作.分享给大家供大家参考,具体如下: 下面的是某一文本文件中的数据. 6.1101,17.592 5.5277,9.1302 8.5186,13.662 7.0032,11.854 5.8598,6.8233 8.3829,11.886 7.4764,4.3483 8.5781,12 6.4862,6.5987 5.0546,3.8166 5.7107,3.2522 14.164,15.505 5.734,3.1551 8.408

  • Python实现的绘制三维双螺旋线图形功能示例

    本文实例讲述了Python实现的绘制三维双螺旋线图形功能.分享给大家供大家参考,具体如下: 代码: # -*- coding:utf-8 -*- #! python3 #绘制三维双螺旋线 import numpy as np import matplotlib.pyplot as plt import mpl_toolkits.mplot3d t=list(range(100,200)) r=[i*np.cos(60+i*360*5) for i in t] theta=[i*np.sin(60

  • python matlibplot绘制3D图形

    本文实例为大家分享了python matlibplot绘制3D图形的具体代码,供大家参考,具体内容如下 1.散点图使用scatter from mpl_toolkits.mplot3d import Axes3D import numpy as np from matplotlib import pyplot as plt # 生成3D示例数据 mu_vec1 = np.array([0,0,0]) # 均值向量 cov_mat1 = np.array([[1,0,0],[0,1,0],[0,0

随机推荐