一文教会你pandas plot各种绘图
目录
- 一、介绍
- 1.1参数介绍
- 1.2其他常用说明
- 二、举例说明
- 2.1折线图line
- 2.2条型图bar
- 2.3直方图hist
- 2.4箱型图box
- 2.5区域图area
- 2.6散点图scatter
- 2.7蜂巢图hexbin
- 2.8饼型图pie
- 三、其他格式
- 3.1设置显示中文标题
- 3.2设置坐标轴显示负号
- 3.3使用误差线yerr进行绘图
- 3.4使用layout将目标分成多个子图
- 3.5使用table绘制表,上图下表
- 3.6使用colormap设置图的区域颜色
- 总结
一、介绍
使用pandas.DataFrame的plot方法绘制图像会按照数据的每一列绘制一条曲线,默认按照列columns的名称在适当的位置展示图例,比matplotlib绘制节省时间,且DataFrame格式的数据更规范,方便向量化及计算。
DataFrame.plot( )函数:
DataFrame.plot(x=None, y=None, kind='line', ax=None, subplots=False,
                sharex=None, sharey=False, layout=None, figsize=None,
                use_index=True, title=None, grid=None, legend=True,
                style=None, logx=False, logy=False, loglog=False,
                xticks=None, yticks=None, xlim=None, ylim=None, rot=None,
                fontsize=None, colormap=None, position=0.5, table=False, yerr=None,
                xerr=None, stacked=True/False, sort_columns=False,
                secondary_y=False, mark_right=True, **kwds)
1.1 参数介绍
- x和y:表示标签或者位置,用来指定显示的索引,默认为None
- kind:表示绘图的类型,默认为line,折线图
- line:折线图
- bar/barh:柱状图(条形图),纵向/横向
- pie:饼状图
- hist:直方图(数值频率分布)
- box:箱型图
- kde:密度图,主要对柱状图添加Kernel 概率密度线
- area:区域图(面积图)
- scatter:散点图
- hexbin:蜂巢图
- ax:子图,可以理解成第二坐标轴,默认None
- subplots:是否对列分别作子图,默认False
- sharex:共享x轴刻度、标签。如果ax为None,则默认为True,如果传入ax,则默认为False
- sharey:共享y轴刻度、标签
- layout:子图的行列布局,(rows, columns)
- figsize:图形尺寸大小,(width, height)
- use_index:用索引做x轴,默认True
- title:图形的标题
- grid:图形是否有网格,默认None
- legend:子图的图例
- style:对每列折线图设置线的类型,list or dict
- logx:设置x轴刻度是否取对数,默认False
- logy
- loglog:同时设置x,y轴刻度是否取对数,默认False
- xticks:设置x轴刻度值,序列形式(比如列表)
- yticks
- xlim:设置坐标轴的范围。数值,列表或元组(区间范围)
- ylim
- rot:轴标签(轴刻度)的显示旋转度数,默认None
- fontsize : int, default None#设置轴刻度的字体大小
- colormap:设置图的区域颜色
- colorbar:柱子颜色
- position:柱形图的对齐方式,取值范围[0,1],默认0.5(中间对齐)
- table:图下添加表,默认False。若为True,则使用DataFrame中的数据绘制表格
- yerr:误差线
- xerr
- stacked:是否堆积,在折线图和柱状图中默认为False,在区域图中默认为True
- sort_columns:对列名称进行排序,默认为False
- secondary_y:设置第二个y轴(右辅助y轴),默认为False
- mark_right : 当使用secondary_y轴时,在图例中自动用“(right)”标记列标签 ,默认True
- x_compat:适配x轴刻度显示,默认为False。设置True可优化时间刻度的显示
1.2 其他常用说明
- color:颜色
- s:散点图大小,int类型
- 设置x,y轴名称
- ax.set_ylabel(‘yyy’)
- ax.set_xlabel(‘xxx’)
二、举例说明
2.1 折线图 line
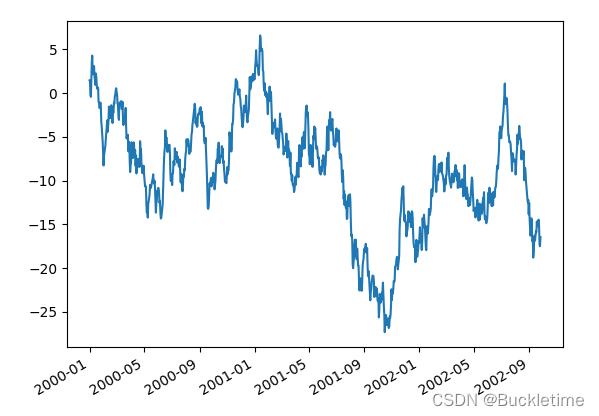
1. 基本用法
ts = pd.Series(np.random.randn(1000), index=pd.date_range("1/1/2000", periods=1000))
ts = ts.cumsum()
ts.plot();

2. 展示多列数据
df = pd.DataFrame(np.random.randn(1000, 4), index=pd.date_range("1/1/2000", periods=1000), columns=list("ABCD"))
df = df.cumsum()
df.plot()

3. 使用x和y参数,绘制一列与另一列的对比
df3 = pd.DataFrame(np.random.randn(1000, 2), columns=["B", "C"]).cumsum()
df3["A"] = pd.Series(list(range(1000)))
df3.plot(x="A", y="B")

4. secondary_y参数,设置第二Y轴及图例位置
ts = pd.Series(np.random.randn(1000), index=pd.date_range('1/1/2000', periods=1000))
df = pd.DataFrame(np.random.randn(1000, 4), index=ts.index, columns=list('ABCD'))
df = df.cumsum()
print(df)
# 图1:其中A列用左Y轴标注,B列用右Y轴标注,二者共用一个X轴
df.A.plot()  # 对A列作图,同理可对行做图
df.B.plot(secondary_y=True)  # 设置第二个y轴(右y轴)
# 图2
ax = df.plot(secondary_y=['A', 'B'])  # 定义column A B使用右Y轴。
# ax(axes)可以理解为子图,也可以理解成对黑板进行切分,每一个板块就是一个axes
ax.set_ylabel('CD scale')   # 主y轴标签
ax.right_ax.set_ylabel('AB scale')  # 第二y轴标签
ax.legend(loc='upper left')  # 设置图例的位置
ax.right_ax.legend(loc='upper right')   # 设置第二图例的位置

5. x_compat参数,X轴为时间刻度的良好展示
ts = pd.Series(np.random.randn(1000), index=pd.date_range("1/1/2000", periods=1000))
ts = ts.cumsum()
ts.plot(x_compat=True)

6. color参数,设置多组图形的颜色
df = pd.DataFrame(np.random.randn(1000, 4), index=pd.date_range('1/1/2000', periods=1000),
                  columns=list('ABCD')).cumsum()
df.A.plot(color='red')
df.B.plot(color='blue')
df.C.plot(color='yellow')

2.2 条型图 bar
DataFrame.plot.bar() 或者 DataFrame.plot(kind=‘bar’)
1. 基本用法
df2 = pd.DataFrame(np.random.rand(10, 4), columns=["a", "b", "c", "d"])
df2.plot.bar()

2. 参数stacked=True,生成堆积条形图
df2.plot.bar(stacked=True)

3. 使用barh,生成水平条形图
df2.plot.barh()

4. 使用rot参数,设置轴刻度的显示旋转度数
df2.plot.bar(rot=0) # 0表示水平显示

2.3 直方图 hist
1. 基本使用
df3 = pd.DataFrame(
    {
        "a": np.random.randn(1000) + 1,
        "b": np.random.randn(1000),
        "c": np.random.randn(1000) - 1,
    },
    columns=["a", "b", "c"],
)
# alpha设置透明度
df3.plot.hist(alpha=0.5)
# 设置坐标轴显示负号
plt.rcParams['axes.unicode_minus']=False

2. 直方图可以使用堆叠,stacked=True。可以使用参数 bins 更改素材箱大小
df3.plot.hist(alpha=0.5,stacked=True, bins=20)

3. 可以使用参数 by 指定关键字来绘制分组直方图
data = pd.Series(np.random.randn(1000))
data.hist(by=np.random.randint(0, 4, 1000), figsize=(6, 4))

2.4 箱型图 box
箱型图,用来可视化每列中值的分布
.1. 基本使用
示例:这里有一个箱形图,代表对[0,1]上的均匀随机变量的10个观察结果进行的五次试验。
df = pd.DataFrame(np.random.rand(10, 5), columns=["A", "B", "C", "D", "E"])
df.plot.box();

2. 箱型图可以通过参数 color 进行着色
color是dict类型,包含的键分别是 boxes, whiskers, medians and caps
color = {
    "boxes": "DarkGreen",
    "whiskers": "DarkOrange",
    "medians": "DarkBlue",
    "caps": "Gray",
}
df.plot.box(color=color, sym="r+")

3. 可以使用参数 vert=False,指定水平方向显示,默认为True表示垂直显示
df.plot.box(vert=False)

4. 可以使用boxplot()方法,绘制带有网格的箱型图
df = pd.DataFrame(np.random.rand(10, 5))
bp = df.boxplot()

5. 可以使用参数 by 指定关键字来绘制分组箱型图
df = pd.DataFrame(np.random.rand(10, 2), columns=["Col1", "Col2"])
df["X"] = pd.Series(["A", "A", "A", "A", "A", "B", "B", "B", "B", "B"])
bp = df.boxplot(by="X")

6. 可以使用多个列进行分组
df = pd.DataFrame(np.random.rand(10, 3), columns=["Col1", "Col2", "Col3"])
df["X"] = pd.Series(["A", "A", "A", "A", "A", "B", "B", "B", "B", "B"])
df["Y"] = pd.Series(["A", "B", "A", "B", "A", "B", "A", "B", "A", "B"])
bp = df.boxplot(column=["Col1", "Col2"], by=["X", "Y"])

2.5 区域图 area
默认情况下,区域图为堆叠。要生成区域图,每列必须全部为正值或全部为负值。
1. 基本使用
df = pd.DataFrame(np.random.rand(10, 4), columns=["a", "b", "c", "d"])
df.plot.area()

2.6 散点图 scatter
散点图需要x和y轴的数字列。 这些可以由x和y关键字指定。
1. 基本使用
df = pd.DataFrame(np.random.rand(50, 4), columns=["a", "b", "c", "d"])
df["species"] = pd.Categorical(
    ["setosa"] * 20 + ["versicolor"] * 20 + ["virginica"] * 10
)
df.plot.scatter(x="a", y="b")

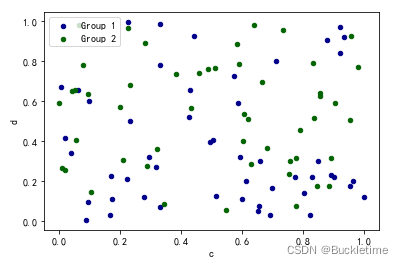
2. 可以使用 参数 ax 和 label 设置多组数据
ax = df.plot.scatter(x="a", y="b", color="DarkBlue", label="Group 1")
df.plot.scatter(x="c", y="d", color="DarkGreen", label="Group 2", ax=ax)

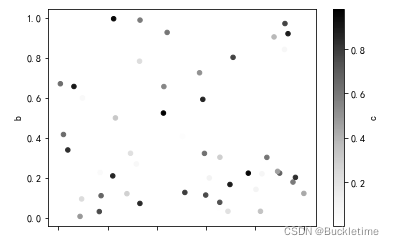
3. 使用参数 c 可以作为列的名称来为每个点提供颜色,参数s可以指定散点大小
df.plot.scatter(x="a", y="b", c="c", s=50)

4. 如果将一个分类列传递给c,那么将产生一个离散的颜色条
df.plot.scatter(x="a", y="b", c="species", cmap="viridis", s=50)

5. 可以使用DataFrame的一列值作为散点的大小
df.plot.scatter(x="a", y="b", s=df["c"] * 200)

2.7 蜂巢图 hexbin
如果数据过于密集而无法单独绘制每个点,则 蜂巢图可能是散点图的有用替代方法。
df = pd.DataFrame(np.random.randn(1000, 2), columns=["a", "b"])
df["b"] = df["b"] + np.arange(1000)
df.plot.hexbin(x="a", y="b", gridsize=25)

2.8 饼型图 pie
如果您的数据包含任何NaN,则它们将自动填充为0。 如果数据中有任何负数,则会引发ValueError
1. 基本使用
series = pd.Series(3 * np.random.rand(4), index=["a", "b", "c", "d"], name="series")
series.plot.pie(figsize=(6, 6))

2. 如果指定subplot =True,则将每个列的饼图绘制为子图。 默认情况下,每个饼图中都会绘制一个图例; 指定legend=False隐藏它。
df = pd.DataFrame(
    3 * np.random.rand(4, 2), index=["a", "b", "c", "d"], columns=["x", "y"]
)
df.plot.pie(subplots=True, figsize=(8, 4))

3. autopct 显示所占总数的百分比
series.plot.pie(
    labels=["AA", "BB", "CC", "DD"],
    colors=["r", "g", "b", "c"],
    autopct="%.2f",
    fontsize=20,
    figsize=(6, 6),
)

三、其他格式
3.1 设置显示中文标题
df = pd.DataFrame(np.random.rand(5, 3), columns=["a", "b", "c"])
df.plot.bar(title='中文标题测试',rot=0)
# 默认不支持中文 ---修改RC参数,指定字体
plt.rcParams['font.sans-serif'] = 'SimHei'

3.2 设置坐标轴显示负号
df3 = pd.DataFrame(
    {
        "a": np.random.randn(1000) + 1,
        "b": np.random.randn(1000),
        "c": np.random.randn(1000) - 1,
    },
    columns=["a", "b", "c"],
)
df3.plot.hist(alpha=0.5)
# 设置坐标轴显示负号
plt.rcParams['axes.unicode_minus']=False

3.3 使用误差线 yerr 进行绘图
示例1:使用与原始数据的标准偏绘制组均值
ix3 = pd.MultiIndex.from_arrays([['a', 'a', 'a', 'a', 'b', 'b', 'b', 'b'], ['foo', 'foo', 'bar', 'bar', 'foo', 'foo', 'bar', 'bar']], names=['letter', 'word'])
df3 = pd.DataFrame({'data1': [3, 2, 4, 3, 2, 4, 3, 2], 'data2': [6, 5, 7, 5, 4, 5, 6, 5]}, index=ix3)
# 分组
gp3 = df3.groupby(level=('letter', 'word'))
means = gp3.mean()
errors = gp3.std()
means.plot.bar(yerr=errors,rot=0)

示例2:使用非对称误差线绘制最小/最大范围
mins = gp3.min()
maxs = gp3.max()
errors = [[means[c] - mins[c], maxs[c] - means[c]] for c in df3.columns]
means.plot.bar(yerr=errors,capsize=4, rot=0)

3.4 使用 layout 将目标分成多个子图
df = pd.DataFrame(np.random.randn(1000, 4), index=pd.date_range("1/1/2000", periods=1000), columns=list("ABCD"))
df = df.cumsum()
df.plot(subplots=True, layout=(2, 3), figsize=(6, 6), sharex=False)

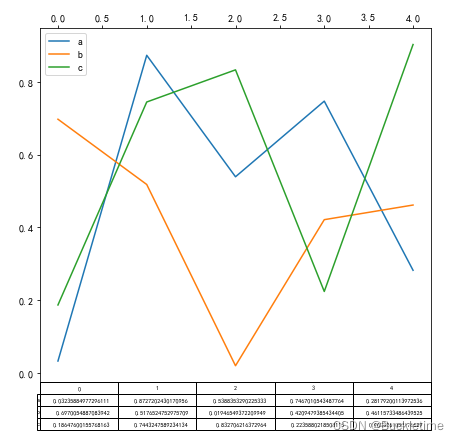
3.5 使用 table 绘制表,上图下表
使用 table=True,绘制表格。图下添加表
fig, ax = plt.subplots(1, 1, figsize=(7, 6.5))
df = pd.DataFrame(np.random.rand(5, 3), columns=["a", "b", "c"])
ax.xaxis.tick_top()  # 在上方展示x轴
df.plot(table=True, ax=ax)

3.6 使用 colormap 设置图的区域颜色
在绘制大量列时,一个潜在的问题是,由于默认颜色的重复,很难区分某些序列。 为了解决这个问题,DataFrame绘图支持使用colormap参数,该参数接受Matplotlib的colormap或一个字符串,该字符串是在Matplotlib中注册的一个colormap的名称。 在这里可以看到默认matplotlib颜色映射的可视化。
df = pd.DataFrame(np.random.randn(1000, 10), index=pd.date_range("1/1/2000", periods=1000))
df = df.cumsum()
df.plot(colormap="cubehelix")

参考文章:https://www.jb51.net/article/188648.htm
总结
到此这篇关于pandas plot各种绘图的文章就介绍到这了,更多相关pandas plot各种绘图内容请搜索我们以前的文章或继续浏览下面的相关文章希望大家以后多多支持我们!

