关于python tushare Tkinter构建的简单股票可视化查询系统(Beta v0.13)
前言:
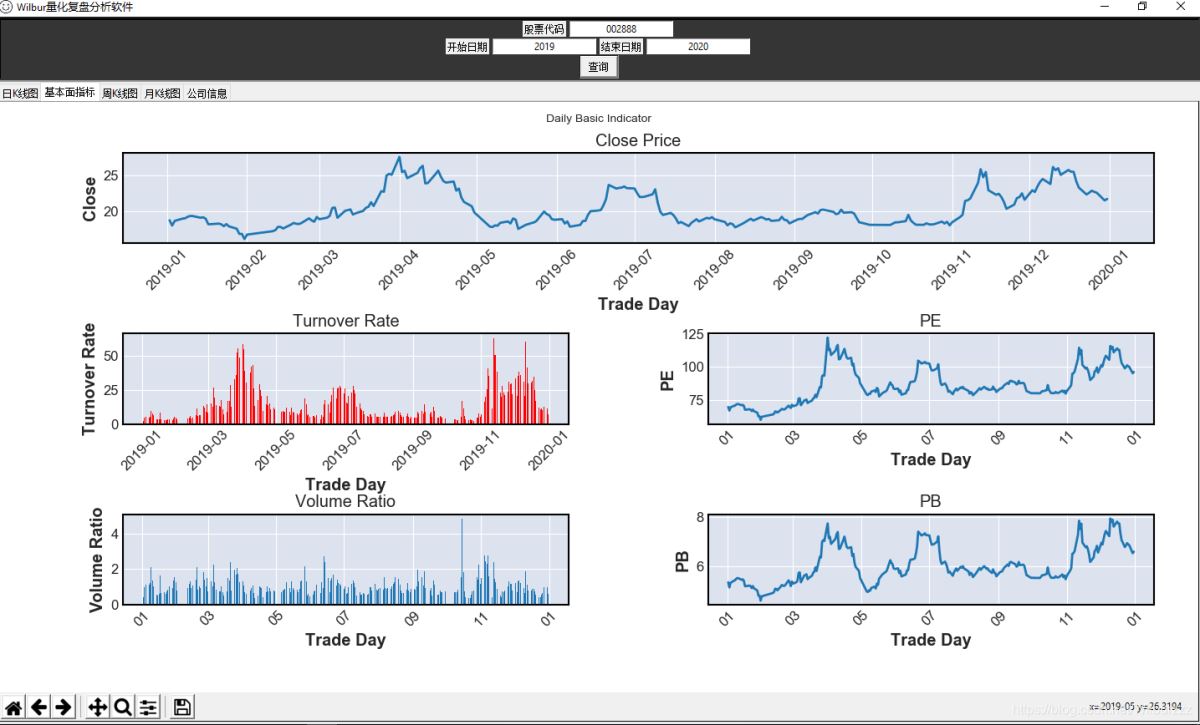
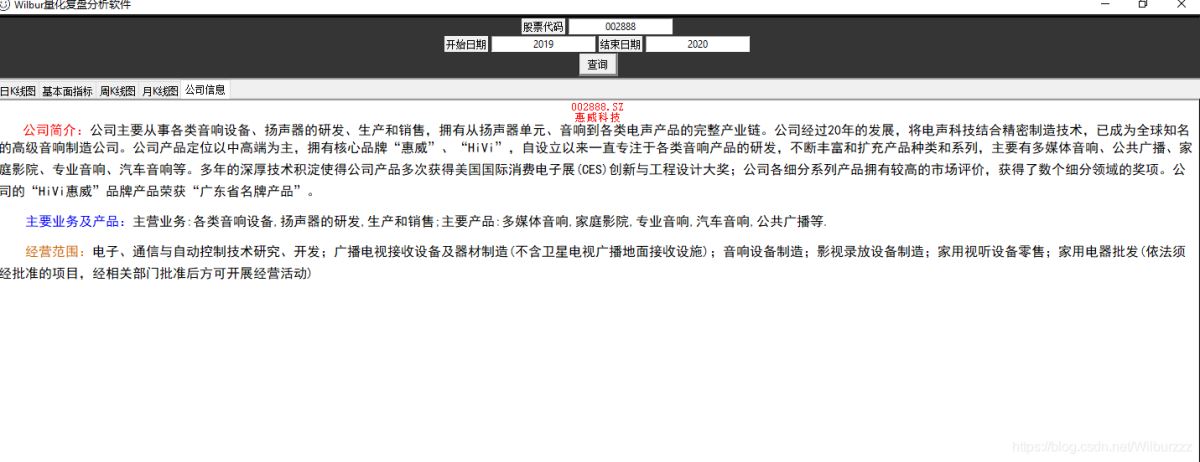
这次比上次新添了公司信息内容跟一个股票基本面指标选项卡,股票基本面指标选项卡用的是matplotlib写的,采用plt.subplot2grid()子图写的,没写主图,在此期间遇到了无法标题中文话,一写就乱码,用过网上很多解决方法,目前也是无解,先记录,后面有时间再解决,如果你有解决方法请务必赐教,实在这个问题卡了我一天多了,如果单单是只用matplotlib输出图形,乱码问题网上的很多方法也是能够解决,我也不清楚究竟是我写的代码哪里跟中文显示冲突了,一时间代码也开始有点乱了,后面估计会越写越乱,等再写一两个功能抽个时间简洁下代码。更新的代码如下:
import pandas as pd
import tushare as ts
import mplfinance as mpf
import tkinter.tix as tix
from tkinter import ttk
import tkinter.font as tf
from tkinter.constants import *
import matplotlib.pyplot as plt
import matplotlib.dates as mdates  #處理日期
from matplotlib.backends.backend_tkagg import (FigureCanvasTkAgg, NavigationToolbar2Tk)

pro = ts.pro_api('要到tushare官网注册个账户然后将token复制到这里,可以的话请帮个忙用文章末我分享的链接注册,谢谢')
plt.rcParams['font.sans-serif'] = ['SimHei']
plt.rcParams['axes.unicode_minus'] = False
# pd.set_option()就是pycharm输出控制显示的设置
pd.set_option('expand_frame_repr', False) # True就是可以换行显示。设置成False的时候不允许换行
pd.set_option('display.max_columns', None) # 显示所有列
# pd.set_option('display.max_rows', None) # 显示所有行
pd.set_option('colheader_justify', 'centre') # 显示居中

root = tix.Tk() # 创建主窗口
screenWidth = root.winfo_screenwidth() # 获取屏幕宽的分辨率
screenHeight = root.winfo_screenheight()
x, y = int(screenWidth / 4), int(screenHeight / 4) # 初始运行窗口屏幕坐标(x, y),设置成在左上角显示
width = int(screenWidth / 2) # 初始化窗口是显示器分辨率的二分之一
height = int(screenHeight / 2)
root.geometry('{}x{}+{}+{}'.format(width, height, x, y)) # 窗口的大小跟初始运行位置
root.title('Wilbur量化复盘分析软件')
# root.resizable(0, 0) # 固定窗口宽跟高,不能调整大小,无法最大窗口化
root.iconbitmap('ZHY.ico') # 窗口左上角图标设置,需要自己放张图标为icon格式的图片文件在项目文件目录下

# 首先创建主框架
main_frame = tix.Frame(root, width=screenWidth, height=screenHeight,
            relief=tix.SUNKEN, bg='#353535', bd=5, borderwidth=4)
main_frame.pack(fill=BOTH, expand=0)

# 在主框架下创建股票代码输入子框架
code_frame = tix.Frame(main_frame, borderwidth=1, bg='#353535')
code_frame.pack()
# 创建标签‘股票代码'
stock_label = tix.Label(code_frame, text='股票代码', bd=1)
stock_label.pack(side=LEFT)
# 创建股票代码输入框
input_code_var = tix.StringVar()
code_widget = tix.Entry(code_frame, textvariable=input_code_var, borderwidth=1, justify=CENTER)
# input_code_get = input_code_var.set(input_code_var.get()) # 获取输入的新值
code_widget.pack(side=LEFT, padx=4)

# 在主框架下创建股票日期输入框子框架
input_date_frame = tix.Frame(main_frame, borderwidth=1, bg='#353535')
input_date_frame.pack()
# 创建标签‘开始日期'
date_start_label = tix.Label(input_date_frame, text='开始日期', bd=1)
date_start_label.pack(side=LEFT)
# 创建开始日期代码输入框
input_startdate_var = tix.StringVar()
startdate_widget = tix.Entry(input_date_frame, textvariable=input_startdate_var, borderwidth=1, justify=CENTER)
input_startdate_get = input_startdate_var.set(input_startdate_var.get()) # 获取输入的新值
startdate_widget.pack(side=LEFT, padx=4)
# 创建标签‘结束日期'
date_end_label = tix.Label(input_date_frame, text='结束日期', bd=1)
date_end_label.pack(side=LEFT)
# 创建结束日期代码输入框
input_enddate_var = tix.StringVar()
enddate_widget = tix.Entry(input_date_frame, textvariable=input_enddate_var, borderwidth=1, justify=CENTER)
input_enddate_get = input_enddate_var.set(input_enddate_var.get()) # 获取输入的新值
enddate_widget.pack(side=LEFT, padx=4)

# 以下函数作用是省略输入代码后缀.sz .sh
def code_name_transform(get_stockcode): # 输入的数字股票代码转换成字符串股票代码
  str_stockcode = str(get_stockcode)
  str_stockcode = str_stockcode.strip() # 删除前后空格字符
  if 6 > len(str_stockcode) > 0:
    str_stockcode = str_stockcode.zfill(6) + '.SZ' # zfill()函数返回指定长度的字符串,原字符串右对齐,前面填充0
  if len(str_stockcode) == 6:
    if str_stockcode[0:1] == '0':
      str_stockcode = str_stockcode + '.SZ'
    if str_stockcode[0:1] == '3':
      str_stockcode = str_stockcode + '.SZ'
    if str_stockcode[0:1] == '6':
      str_stockcode = str_stockcode + '.SH'
  return str_stockcode

tabControl = ttk.Notebook(root) # 创建Notebook
stock_graphics_daily = tix.Frame(root, borderwidth=1, bg='#353535', relief=tix.RAISED) # 增加新选项卡日K线图
# stock_graphics_daily.pack(expand=1, fill=tk.BOTH, anchor=tk.CENTER)
stock_graphics_daily_basic = tix.Frame(root, borderwidth=1, bg='#353535', relief=tix.RAISED) # 增加新选项卡基本面指标
stock_graphics_week = tix.Frame(root, borderwidth=1, bg='#353535', relief=tix.RAISED)
stock_graphics_month = tix.Frame(root, borderwidth=1, bg='#353535', relief=tix.RAISED)
company_information = tix.Frame(root, borderwidth=1, bg='#353535', relief=tix.RAISED)

tabControl.add(stock_graphics_daily, text='日K线图') # 把新选项卡日K线框架增加到Notebook
tabControl.add(stock_graphics_daily_basic, text='基本面指标')
tabControl.add(stock_graphics_week, text='周K线图')
tabControl.add(stock_graphics_month, text='月K线图')
tabControl.add(company_information, text='公司信息')
tabControl.pack(expand=1, fill="both") # 设置选项卡布局
tabControl.select(stock_graphics_daily) # 默认选定日K线图开始

# 创建股票图形输出框架
def go():
  # 清除stock_graphics_daily框架中的控件内容,winfo_children()返回的项是一个小部件列表,
  # 以下代码作用是为每次点击查询按钮时更新图表内容,如果没有以下代码句,则每次点击查询会再生成一个图表
  for widget_daily in stock_graphics_daily.winfo_children():
    widget_daily.destroy()
  for widget_daily_basic in stock_graphics_daily_basic.winfo_children():
    widget_daily_basic.destroy()
  for widget_week in stock_graphics_week.winfo_children():
    widget_week.destroy()
  for widget_month in stock_graphics_month.winfo_children():
    widget_month.destroy()
  for widget_company_information in company_information.winfo_children():
    widget_company_information.destroy()

  stock_name = input_code_var.get()
  code_name = code_name_transform(stock_name)
  start_date = input_startdate_var.get()
  end_date = input_enddate_var.get()

  stock_data = pro.daily(ts_code=code_name, start_date=start_date, end_date=end_date)
  stock_daily_basic = pro.daily_basic(ts_code=code_name, start_date=start_date, end_date=end_date,
                    fields='close,trade_date,turnover_rate,volume_ratio,pe,pb')
  stock_week_data = pro.weekly(ts_code=code_name, start_date=start_date, end_date=end_date)
  stock_month_data = pro.monthly(ts_code=code_name, start_date=start_date, end_date=end_date)
  stock_name_change = pro.namechange(ts_code=code_name, fields='ts_code,name')
  stock_information = pro.stock_company(ts_code=code_name, fields='introduction,main_business,business_scope')

  # 日数据处理
  data = stock_data.loc[:, ['trade_date', 'open', 'close', 'high', 'low', 'vol']] # :取所有行数据,后面取date列,open列等数据
  data = data.rename(columns={'trade_date': 'Date', 'open': 'Open', 'close': 'Close', 'high': 'High', 'low': 'Low',
                'vol': 'Volume'}) # 更换列名,为后面函数变量做准备
  data.set_index('Date', inplace=True) # 设置date列为索引,覆盖原来索引,这个时候索引还是 object 类型,就是字符串类型。
  # 将object类型转化成 DateIndex 类型,pd.DatetimeIndex 是把某一列进行转换,同时把该列的数据设置为索引 index。
  data.index = pd.DatetimeIndex(data.index)
  data = data.sort_index(ascending=True) # 将时间顺序升序,符合时间序列

  # 基本面指标数据处理
  stock_daily_basic.set_index('trade_date', inplace=True) # 设置date列为索引,覆盖原来索引,这个时候索引还是 object 类型,就是字符串类型。
  # 将object类型转化成 DateIndex 类型,pd.DatetimeIndex 是把某一列进行转换,同时把该列的数据设置为索引 index。
  stock_daily_basic.index = pd.DatetimeIndex(stock_daily_basic.index)
  stock_daily_basic = stock_daily_basic.sort_index(ascending=True) # 将时间顺序升序,符合时间序列
  print(stock_daily_basic)

  # 周数据处理
  week_data = stock_week_data.loc[:, ['trade_date', 'open', 'close', 'high', 'low', 'vol']]
  week_data = week_data.rename(columns={'trade_date': 'Date', 'open': 'Open', 'close': 'Close', 'high': 'High',
                     'low': 'Low', 'vol': 'Volume'}) # 更换列名,为后面函数变量做准备
  week_data.set_index('Date', inplace=True) # 设置date列为索引,覆盖原来索引,这个时候索引还是 object 类型,就是字符串类型。
  # 将object类型转化成 DateIndex 类型,pd.DatetimeIndex 是把某一列进行转换,同时把该列的数据设置为索引 index。
  week_data.index = pd.DatetimeIndex(week_data.index)
  week_data = week_data.sort_index(ascending=True) # 将时间顺序升序,符合时间序列

  # 月数据处理
  month_data = stock_month_data.loc[:, ['trade_date', 'open', 'close', 'high', 'low', 'vol']]
  month_data = month_data.rename(columns={'trade_date': 'Date', 'open': 'Open', 'close': 'Close', 'high': 'High',
                      'low': 'Low', 'vol': 'Volume'}) # 更换列名,为后面函数变量做准备
  month_data.set_index('Date', inplace=True) # 设置date列为索引,覆盖原来索引,这个时候索引还是 object 类型,就是字符串类型。
  # 将object类型转化成 DateIndex 类型,pd.DatetimeIndex 是把某一列进行转换,同时把该列的数据设置为索引 index。
  month_data.index = pd.DatetimeIndex(month_data.index)
  month_data = month_data.sort_index(ascending=True) # 将时间顺序升序,符合时间序列

  # 公司信息处理
  stock_company_code = stock_name_change.at[0, 'ts_code']
  stock_company_name = stock_name_change.at[0, 'name']
  stock_introduction = stock_information.at[0, 'introduction']
  stock_main_business = stock_information.at[0, 'main_business']
  stock_business_scope = stock_information.at[0, 'business_scope']

  # K线图图形输出
  daily_fig, axlist = mpf.plot(data, type='candle', mav=(5, 10, 20), volume=True,
                 show_nontrading=False, returnfig=True)
  # 注意必须按照选项卡的排列顺序渲染图形输出,假如你把matplotlib的图形放到最后,则会出现图像错位现象,不信你可以把以下的代码放到month_fig后试下
  plt_stock_daily_basic = plt.figure(facecolor='white')
  plt.suptitle('Daily Basic Indicator', size=10)

  fig_close = plt.subplot2grid((3, 2), (0, 0), colspan=2) # 创建网格子绘图,按行切分成3份,列切分成2分,位置(0,0),横向占用2列
  fig_close.set_title('Close Price')
  plt.xticks(stock_daily_basic.index, rotation=45) # 设置x轴时间显示方向,放在这跟放在最后显示效果不一样
  fig_close.plot(stock_daily_basic.index, stock_daily_basic['close'])
  plt.xlabel('Trade Day')
  plt.ylabel('Close')
  plt.gca().xaxis.set_major_formatter(mdates.DateFormatter('%Y-%m')) # 設置x軸主刻度顯示格式(日期)
  plt.gca().xaxis.set_major_locator(mdates.MonthLocator(interval=1)) # 設置x軸主刻度間距

  fig_turnover_rate = plt.subplot2grid((3, 2), (1, 0)) # 创建网格子绘图,按行切分成3份,列切分成2分,位置(1,0)
  fig_turnover_rate.set_title('Turnover Rate')
  plt.xticks(stock_daily_basic.index, rotation=45) # 设置x轴时间显示方向,放在这跟放在最后显示效果不一样
  fig_turnover_rate.bar(stock_daily_basic.index, stock_daily_basic['turnover_rate'], facecolor='red')
  plt.xlabel('Trade Day')
  plt.ylabel('Turnover Rate')
  plt.gca().xaxis.set_major_formatter(mdates.DateFormatter('%Y-%m')) # 設置x軸主刻度顯示格式(日期)
  plt.gca().xaxis.set_major_locator(mdates.MonthLocator(interval=2)) # 設置x軸主刻度間距

  fig_volume_ratio = plt.subplot2grid((3, 2), (2, 0)) # 创建网格子绘图,按行切分成3份,列切分成2分,位置(1,2)
  fig_volume_ratio.set_title('Volume Ratio')
  plt.xticks(stock_daily_basic.index, rotation=45) # 设置x轴时间显示方向,放在这跟放在最后显示效果不一样
  fig_volume_ratio.bar(stock_daily_basic.index, stock_daily_basic['volume_ratio'])
  plt.xlabel('Trade Day')
  plt.ylabel('Volume Ratio')
  plt.gca().xaxis.set_major_formatter(mdates.DateFormatter('%m')) # 設置x軸主刻度顯示格式(日期)
  plt.gca().xaxis.set_major_locator(mdates.MonthLocator(interval=2)) # 設置x軸主刻度間距

  fig_pe = plt.subplot2grid((3, 2), (1, 1)) # 创建网格子绘图,按行切分成3份,列切分成2分,位置在第3行,第1列
  fig_pe.set_title('PE')
  plt.xticks(stock_daily_basic.index, rotation=45) # 设置x轴时间显示方向,放在这跟放在最后显示效果不一样
  fig_pe.plot(stock_daily_basic.index, stock_daily_basic['pe'])
  plt.xlabel('Trade Day')
  plt.ylabel('PE')
  plt.gca().xaxis.set_major_formatter(mdates.DateFormatter('%m')) # 設置x軸主刻度顯示格式(日期)
  plt.gca().xaxis.set_major_locator(mdates.MonthLocator(interval=2)) # 設置x軸主刻度間距

  fig_pb = plt.subplot2grid((3, 2), (2, 1)) # 创建网格子绘图,按行切分成3份,列切分成2分,位置在第3行,第2列
  fig_pb.set_title('PB')
  plt.xticks(stock_daily_basic.index, rotation=45) # 设置x轴时间显示方向,放在这跟放在最后显示效果不一样
  fig_pb.plot(stock_daily_basic.index, stock_daily_basic['pb'])
  plt.xlabel('Trade Day')
  plt.ylabel('PB')
  plt.gca().xaxis.set_major_formatter(mdates.DateFormatter('%m')) # 設置x軸主刻度顯示格式(日期)
  plt.gca().xaxis.set_major_locator(mdates.MonthLocator(interval=2)) # 設置x軸主刻度間距
  plt_stock_daily_basic.tight_layout(h_pad=-2, w_pad=0) # 解决子图图形重叠问题

  week_fig, axlist = mpf.plot(week_data, type='candle', mav=(5, 10, 20), volume=True,
                show_nontrading=False, returnfig=True)
  month_fig, axlist = mpf.plot(month_data, type='candle', mav=(5, 10, 20), volume=True,
                 show_nontrading=False, returnfig=True)

  canvas_daily = FigureCanvasTkAgg(daily_fig, master=stock_graphics_daily) # 设置tkinter绘制区
  canvas_daily.draw()
  toolbar_daily = NavigationToolbar2Tk(canvas_daily, stock_graphics_daily)
  toolbar_daily.update() # 显示图形导航工具条
  canvas_daily._tkcanvas.pack(side=BOTTOM, fill=BOTH, expand=1)

  canvas_stock_daily_basic = FigureCanvasTkAgg(plt_stock_daily_basic, master=stock_graphics_daily_basic)
  canvas_stock_daily_basic.draw()
  toolbar_stock_daily_basic = NavigationToolbar2Tk(canvas_stock_daily_basic, stock_graphics_daily_basic)
  toolbar_stock_daily_basic.update() # 显示图形导航工具条
  canvas_stock_daily_basic._tkcanvas.pack(side=BOTTOM, fill=BOTH, expand=1)
  plt.close()

  canvas_week = FigureCanvasTkAgg(week_fig, master=stock_graphics_week) # 设置tkinter绘制区
  canvas_week.draw()
  toolbar_week = NavigationToolbar2Tk(canvas_week, stock_graphics_week)
  toolbar_week.update() # 显示图形导航工具条
  canvas_week._tkcanvas.pack(side=BOTTOM, fill=BOTH, expand=1)

  canvas_month = FigureCanvasTkAgg(month_fig, master=stock_graphics_month) # 设置tkinter绘制区
  canvas_month.draw()
  toolbar_month = NavigationToolbar2Tk(canvas_month, stock_graphics_month)
  toolbar_month.update() # 显示图形导航工具条
  canvas_month._tkcanvas.pack(side=BOTTOM, fill=BOTH, expand=1)

  company_text = tix.Text(company_information, bg='white', undo=True, wrap=tix.CHAR)

  company_text.insert(tix.INSERT, stock_company_code)
  company_text.tag_add('tag1', '1.0', '1.9')
  company_text.tag_config('tag1', foreground='red', justify=CENTER)
  company_text.insert(tix.INSERT, '\n')

  company_text.insert(tix.INSERT, stock_company_name)
  company_text.tag_add('tag2', '2.0', '2.9')
  company_text.tag_config('tag2', foreground='red', justify=CENTER)
  company_text.insert(tix.INSERT, '\n')

  company_text.insert(tix.INSERT, '  ')
  company_text.insert(tix.INSERT, '公司简介:')
  company_text.tag_add('tag3', '3.3', '3.9')
  company_text.tag_config('tag3', foreground='red', font=tf.Font(family='SimHei', size=12))
  company_text.insert(tix.INSERT, stock_introduction)
  company_text.tag_add('tag4', '3.9', 'end')
  company_text.tag_config('tag4', foreground='black', spacing1=20, spacing2=10,
              font=tf.Font(family='SimHei', size=12))
  company_text.insert(tix.INSERT, '\n')

  company_text.insert(tix.INSERT, '  ')
  company_text.insert(tix.INSERT, '主要业务及产品:')
  company_text.tag_add('tag5', '4.4', '4.12')
  company_text.tag_config('tag5', foreground='blue')
  company_text.insert(tix.INSERT, stock_main_business)
  company_text.tag_add('tag6', '4.12', 'end')
  company_text.tag_config('tag6', spacing1=20, spacing2=10,
              font=tf.Font(family='SimHei', size=12))
  company_text.insert(tix.INSERT, '\n')

  company_text.insert(tix.INSERT, '  ')
  company_text.insert(tix.INSERT, '经营范围:')
  company_text.tag_add('tag7', '5.4', '5.9')
  company_text.tag_config('tag7', foreground='#cc6600')
  company_text.insert(tix.INSERT, stock_business_scope)
  company_text.tag_add('tag8', '5.9', 'end')
  company_text.tag_config('tag8', spacing1=20, spacing2=10,
              font=tf.Font(family='SimHei', size=12))
  company_text.insert(tix.INSERT, '\n')

  company_text.pack(fill=BOTH, expand=1)

# 在主框架下创建查询按钮子框架
search_frame = tix.Frame(main_frame, borderwidth=1, bg='#353535', relief=tix.SUNKEN)
search_frame.pack()
# 创建查询按钮并设置功能
stock_find = tix.Button(search_frame, text='查询', width=5, height=1, command=go)
stock_find.pack()

root.mainloop()
效果图:


到此这篇关于python tushare Tkinter构建的简单股票可视化查询系统(Beta v0.13)的文章就介绍到这了,更多相关python tushare可视化内容请搜索我们以前的文章或继续浏览下面的相关文章希望大家以后多多支持我们!
赞 (0)

