matplotlib共享坐标轴的实现(X或Y坐标轴)
前言
1. 概述
共享坐标轴就是几幅子图之间共享x轴或y轴,这一部分主要了解如何在利用matplotlib制图时共享坐标轴。
pyplot.subplots(nrows = 1,ncols = 1,sharex = False,sharey = False,
squeeze = True,subplot_kw =无,gridspec_kw =无,** fig_kw )
参数:
nrows:行数
ncols:列数
sharex:是否共享X轴坐标
sharey:是否共享Y轴坐标
返回值:Figure,Axes对象数组
一、sharex和sharey 代码示例:
'''
1. 程序目的:
   基于sharex和sharey实现
     (1) 共享x轴
     (2) 共享y轴
     (3) 同时共享x轴和y轴
     (4) 调整子图之间的距离

2. 版本
   2.1 山东青岛  2021年5月18日  Version 1

'''

# 1. 相关模块导入
import numpy as np
import matplotlib.pyplot as plt

plt.rcParams['font.sans-serif'] = ['SimHei'] # 正常显示中文字体
plt.rcParams['axes.unicode_minus'] = False  # 正常显示负号

# 2. 创建制图数据
x = np.linspace(-5,5,100)
y_1 = np.sin(x)
y_2 = np.cos(x)
y_3 = y_2*2

# 3. 绘图
  # 3.1 共享X轴
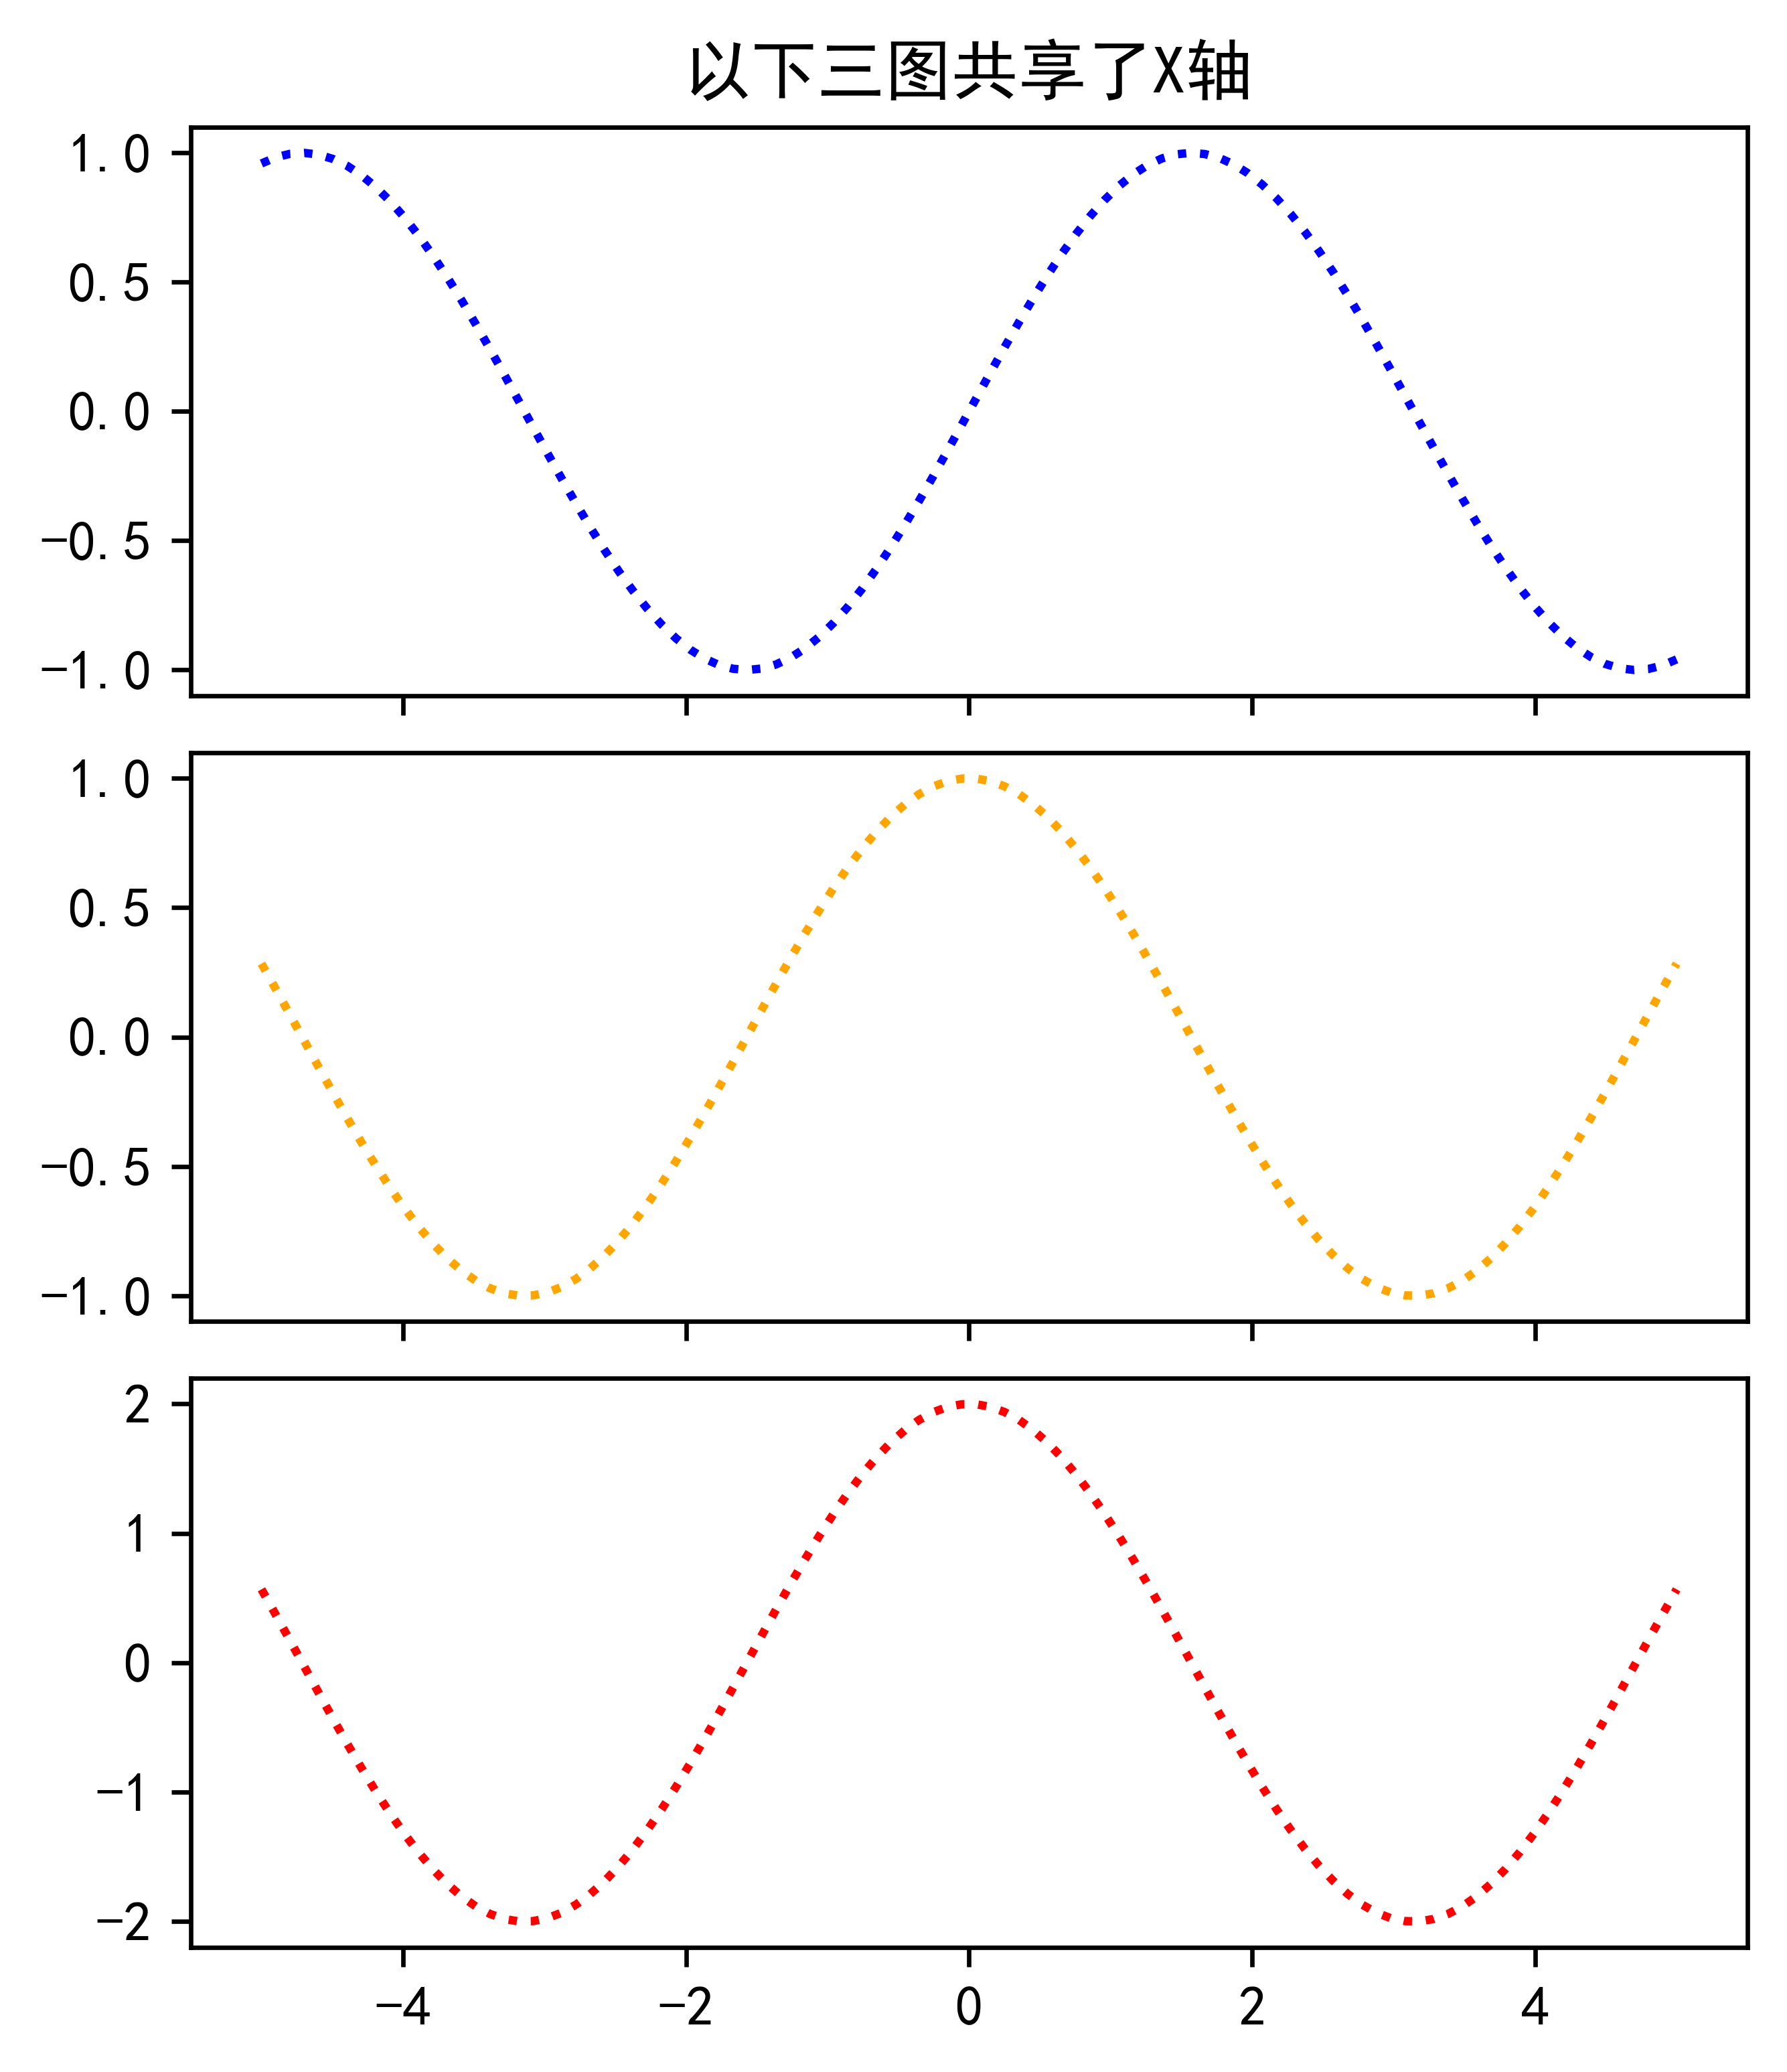
figure,(ax1,ax2,ax3) = plt.subplots(3,1,
                                    figsize=(5,6),
                                    dpi=600,
                                    # 共享x轴
                                    sharex=True)

ax1.plot(x,y_1,c='blue',linestyle=':')
ax2.plot(x,y_2,c='orange',linestyle=':')
ax3.plot(x,y_3,c='r',linestyle=':')

    # 调整子图形之间的纵向距离
figure.subplots_adjust(hspace=0.1)

ax1.set_title('以下三图共享了X轴')  # 其实更合理的添加图名时figure.subtitle()

  # 3.2 共享Y轴
    # 创建新的绘图figure和axes对象
figure,(ax1,ax2,ax3) = plt.subplots(1,3,
                                    figsize=(6,2),
                                    dpi=600,
                                    # 共享y轴
                                    sharey=True)
figure.suptitle('以下三图共享了Y轴')
ax1.plot(x,y_1,c='blue',linestyle=':')
ax2.plot(x,y_2,c='orange',linestyle=':')
ax3.plot(x,y_3,c='r',linestyle=':')
    # 调整子图形之间的横向距离
figure.subplots_adjust(wspace=0.1)

  # 3.3 同时共享x轴和y轴
    # 创建新的绘图figure和axes对象
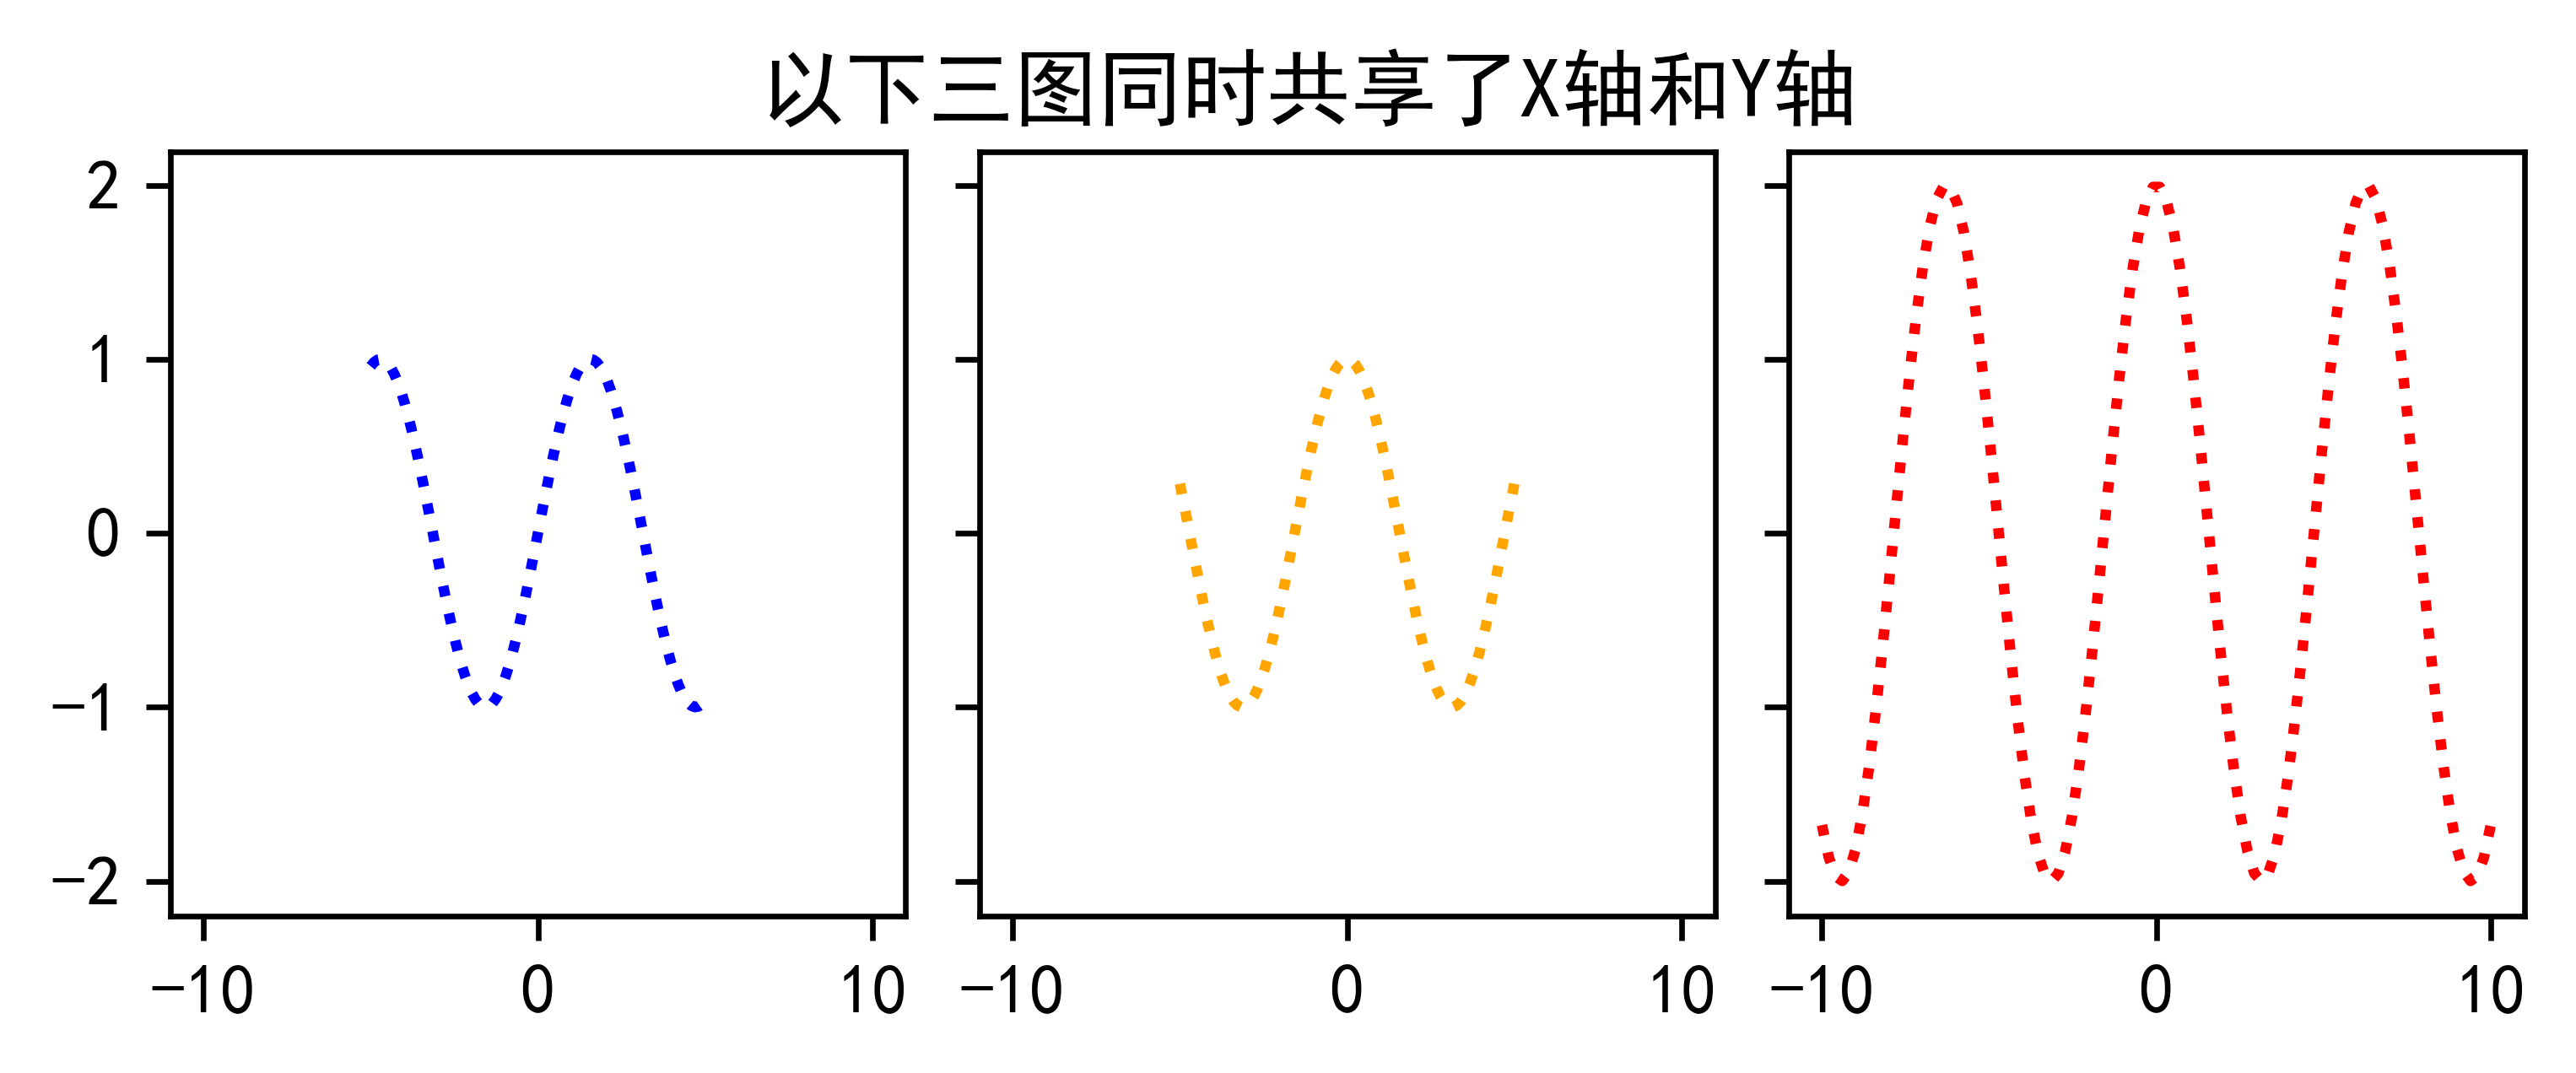
figure,(ax1,ax2,ax3) = plt.subplots(1,3,
                                    figsize=(6,2),
                                    dpi=600,
                                    # 共享x轴
                                    sharex=True,
                                    # 共享y轴
                                    sharey=True)

x4 = np.linspace(-10,10,100)
y_4 = np.cos(x4)*2

figure.suptitle('以下三图同时共享了X轴和Y轴')
ax1.plot(x,y_1,c='blue',linestyle=':')
ax2.plot(x,y_2,c='orange',linestyle=':')
ax3.plot(x4,y_4,c='r',linestyle=':')

    # 调整子图形之间的横向距离
figure.subplots_adjust(wspace=0.1)

plt.show()
制图结果:


实例2

import matplotlib.pyplot as plt
import numpy as np
plt.rcParams['font.sans-serif']=['SimHei']
plt.rcParams['axes.unicode_minus']=False
x=np.linspace(0,2*np.pi,500)
y=np.sin(x)*np.exp(-x)
fig,ax=plt.subplots(nrows=1,ncols=2,sharey=True)
ax1=ax[0]
ax1.plot(x,y)
ax1.set_title("折线图")

ax2=ax[1]
ax2.scatter(x,y)
ax2.set_title("散点图")
plt.suptitle("一张画布两个子图,并共享y坐标")
#删除空隙wspace为两图的水平距离,hspace为两图的垂直距离
fig.subplots_adjust(wspace=0)
plt.show()

import matplotlib.pyplot as plt
import numpy as np
plt.rcParams['font.sans-serif']=['SimHei']
plt.rcParams['axes.unicode_minus']=False
x=np.linspace(0,2*np.pi,500)
y=np.sin(x)*np.exp(-x)
fig,ax=plt.subplots(nrows=1,ncols=1)
ax.plot(x,y)
ax.set_title("折线图")
ax.scatter(x,y[::-1])
plt.suptitle("共享单一绘图区域的坐标轴")
plt.show()
到此这篇关于matplotlib共享坐标轴的实现(X或Y坐标轴)的文章就介绍到这了,更多相关matplotlib共享坐标轴内容请搜索我们以前的文章或继续浏览下面的相关文章希望大家以后多多支持我们!
赞 (0)

