学会Python数据可视化必须尝试这7个库
目录
- 一、Seaborn
- 二、Plotly
- 三、Geoplotlib
- 四、Gleam
- 五、ggplot
- 六、Bokeh
- 七、Missingo
一、Seaborn
Seaborn 建于 matplotlib 库的之上。它有许多内置函数,使用这些函数,只需简单的代码行就可以创建漂亮的绘图。它提供了多种高级的可视化绘图和简单的语法,如方框图、小提琴图、距离图、关节图、成对图、热图等。
安装
ip install seaborn
主要特征:
- 可用于确定两个变量之间的关系。
- 在分析单变量或双变量分布时进行区分。
- 绘制因变量的线性回归模型。
- 提供多网格绘图
只需使用几行简单代码就可以绘制出漂亮的图形


官方文档
https://seaborn.pydata.org/
二、Plotly
Plotly 是一个高级 Python 分析库,有助于构建交互式仪表板。使用 Plotly 构建的图形是交互式图形,这意味着你可以轻松找到图形的任何特定点或会话的值。Plotly 生成仪表板并将其部署在服务器上变得非常容易。它支持 Python、R 和 Julia 编程语言。
Plotly 制作简单散点图的代码:

官方文档
https://dash.plotly.com/
三、Geoplotlib
Geoplotlib 是一个用于可视化地理数据和制作地图的 Python 工具箱。你可以使用此库创建各种地图。您可以使用它创建的一些地图示例包括热图、点密度图、地理地图等等。

安装
pip install geoplotlib
github文档
https://github.com/andrea-cuttone/geoplotlib/wiki/User-Guide
四、Gleam
Gleam 的灵感来自 R 的Shiny包。它允许你仅使用 Python 代码将图形转换为出色的 Web 应用程序。这对不了解 HTML 和 CSS 的人很有帮助。它不是真正的可视化库,而是与任何可视化库一起使用。

github文档
https://github.com/dgrtwo/gleam
五、ggplot
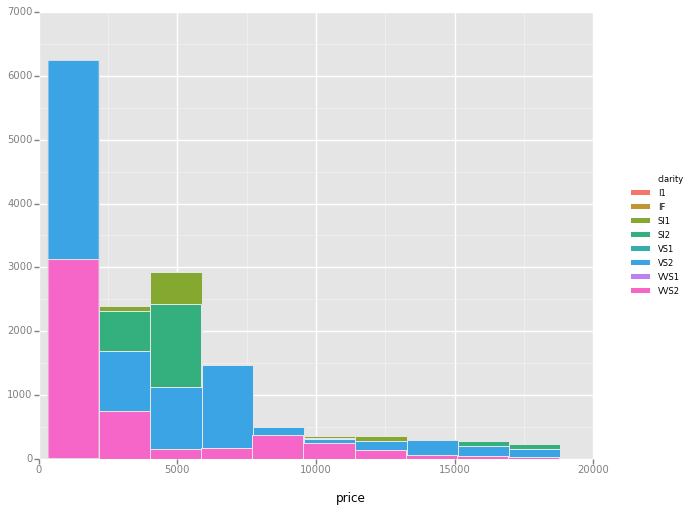
ggplot 的工作方式与 matplotlib 不同。它允许你添加多个组件作为图层,以在最后创建完整的图形或绘图。例如,在开始时你可以添加一个轴,然后添加点和其他组件,如趋势线。
%matplotlib inline
from ggplot import *
ggplot(diamonds, aes(x='price', fill='clarity')) + geom_histogram()

github文档
https://github.com/tidyverse/ggplot2
六、Bokeh
Bokeh 库由Continuum Analytics创建,用于生成对 Web 界面和浏览器友好的可视化。Bokeh 生成的可视化本质上是交互式的,可让你传达更多信息。
# Bokeh Libraries
from bokeh.io import output_file
from bokeh.plotting import figure, show

# The figure will be rendered in a static HTML file called output_file_test.html
output_file('output_file_test.html',
            title='Empty Bokeh Figure')

# Set up a generic figure() object
fig = figure()

# See what it looks like
show(fig)
官方文档
https://docs.bokeh.org/en/latest/
七、Missingo
数据科学就是从给定的数据中找到有用的信息,并使之对所有人可见。 最好的方法是将数据可视化。对于所有的数据科学家爱好者来说,这个包可能是一个热潮。它可以帮助你找到所有缺失值,并在现实世界的数据集中以漂亮的图形方式显示它们,而无需头疼,只需一行代码。 它支持图形表示,如条形图、图表、热图、树状图等。
# Importing Necessary Libraries
import pandas as pd
import missingno as mi

# Reading the Titanic dataset (From Local Env)
data = pd.read_csv("train.csv")

# Checking missing values Using ()
print(data.isnull().sum()) ## It will display a table with all the missing values

### The best practice is to visualize this so that everyone even a non-tech person
### can understand and find the missing values, Let's use the `missingno` package
#Visualizing using missingno

print("Visualizing missing value using bar graph")
print(mi.bar(data, figsize = (10,5)))

到此这篇关于Python数据可视化必须尝试这7个库的文章就介绍到这了,更多相关Python数据可视化库内容请搜索我们以前的文章或继续浏览下面的相关文章希望大家以后多多支持我们!

