Vue echart实现柱状图,电池图,3D柱图和3D圆柱图代码详解

目录
  • 电池图
  • 3D柱状图+3个柱图+图例不能点击
  • 3D圆筒柱状图
  • 3D圆筒柱状图+背景
  • 电池图
  • 自动播放+底部可拖拽
  • 比电池图好看一点的进度条
  • 总结

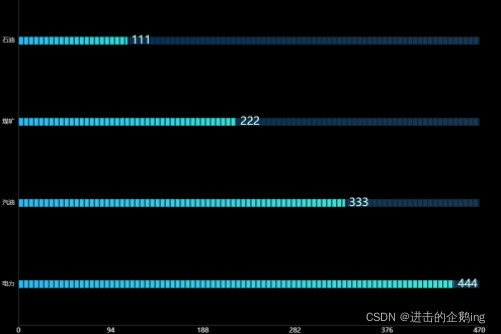
电池图

let backgroundColor = 'rgba(0,0,0,1)';
let chartdata = [
    [111, 222, 333, 444],
    ['石油', '煤矿', '汽油', '电力'],
];
var getmydmc = chartdata[1]; //数据点名称
var getmyd = chartdata[0]; //收入金额
var getmydzd = [];
let big = 0;
getmyd.forEach((el) => {
    if (!(el === undefined || el === '')) {
        if (big < Number(el)) {
            big = Number(el);
        }
    }
});
for (let i = 0; i < getmyd.length; i++) {
    getmydzd.push(big * 4);
}
//计算最大值
function calMax(arr) {
    let max = 0;
    arr.forEach((el) => {
        el.forEach((el1) => {
            if (!(el1 === undefined || el1 === '')) {
                if (max < Number(el1)) {
                    max = Number(el1);
                }
            }
        });
    });
    let maxint = Math.ceil(max / 9.5);
    //不让最高的值超过最上面的刻度
    let maxval = maxint * 10;
    //让显示的刻度是整数
    return maxval;
}
var max = Math.ceil(calMax([getmyd]) / 10) * 10;
option = {
    backgroundColor: backgroundColor,
    grid: {
        left: '3%',
        right: '13%',
        bottom: '10%',
        top: '10%',
        containLabel: true,
    },
    tooltip: {
        formatter: (params) => {
            if (params.name !== '') {
                return params.name+ ' : ' + getmyd[params.dataIndex];
            }
        },
        textStyle: {
            align: 'left',
        },
    },
    xAxis: [
        {
            type: 'value',
            axisLabel: {
                margin: 5,
                color: '#fff',
                formatter: function (val) {
                    return val + '';
                },
                textStyle: {
                    fontSize: '13',
                },
            },
            min: 0,
            max: max, // 计算最大值
            interval: max / 5, //  平均分为5份
            splitNumber: 5,
            splitLine: {
                show: false,
                lineStyle: {
                    color: '#fff',
                },
            },
            axisLine: {
                show: true,
                lineStyle: {
                    color: '#fff',
                    width: 1,
                    opacity: 0.3,
                },
            },
            axisTick: {
                show: false,
            },
        },
        {
            type: 'value',
            axisLabel: {
                show: false,
            },
            min: 0,
            max: max, // 计算最大值
            interval: max / 10, //  平均分为5份
            splitNumber: 10,
            splitLine: {
                show: false,
                lineStyle: {
                    type: 'dashed',
                    color: '#D8D8D8',
                },
            },
            axisLine: {
                show: false,
                lineStyle: {
                    color: '#fff',
                },
            },
            axisTick: {
                show: false,
            },
        },
    ],
    yAxis: [
        {
            type: 'category',
            inverse: true,
            //  boundaryGap:true,
            axisLabel: {
                formatter: (value, index) => {
                    if (value.length >= 12) {
                        value = value.slice(0, 12) + `\n` + value.slice(12);
                    }
                    if (value.length >= 26) {
                        value = value.slice(0, 26) + `\n` + value.slice(26);
                    }
                    return value;
                },
                textStyle: {
                    color: 'rgba(255,255,255,0.8)',
                    fontSize: '12',
                    align: 'right',
                    lineHeight: 18,
                },
            },
            splitLine: {
                show: false,
            },
            axisTick: {
                show: false,
            },
            axisLine: {
                lineStyle: {
                    color: '#fff',
                    width: 1,
                    opacity: 0.3,
                },
            },
            data: getmydmc,
        },
    ],
    dataZoom: [
        {
            type: 'inside',
            show: true,
            height: 15,
            start: 1,
            end: 100,
            orient: 'vertical',
            zlevel: 66,
        },
    ],
    series: [
        {
            name: '值',
            type: 'bar',
            // zlevel: 1,
            xAxisIndex: 0,
            itemStyle: {
                normal: {
                    // barBorderRadius: [0, 5, 5, 0],
                    color: {
                        colorStops: [
                            {
                                offset: 0,
                                color: '#40cbe8', // 0% 处的颜色
                            },
                            {
                                offset: 1,
                                color: '#3afbc2', // 100% 处的颜色
                            },
                        ],
                    },
                },
            },
            barWidth: 15,
            data: getmyd,
            z: 0,
        },
        {
            // 分隔
            type: 'pictorialBar',
            itemStyle: {
                normal: {
                    color: '#022539',
                },
            },
            symbolRepeat: 'fixed',
            symbolMargin: 4,
            symbol: 'rect',
            symbolClip: true,
            symbolSize: [2, 15],
            symbolPosition: 'start',
            symbolOffset: [-1, 0],
            data: getmydzd,
            z: 66,
            animationEasing: 'elasticOut',
        },
        {
            name: '背景',
            type: 'bar',
            barWidth: 15,
            barGap: '-100%',
            xAxisIndex: 1,
            data: getmydzd,
            itemStyle: {
                normal: {
                    color: {
                        colorStops: [
                            {
                                offset: 0,
                                color: 'rgba(24,144,255,0.3)', // 0% 处的颜色
                            },
                            {
                                offset: 1,
                                color: 'rgba(99,180,255,0.3)', // 100% 处的颜色
                            },
                        ],
                    },
                },
            },
            z: 0,
        },
        {
            // 外边框
            type: 'pictorialBar',
            symbol: 'rect',
            itemStyle: {
                normal: {
                    color: 'none',
                },
            },
            label: {
                normal: {
                    formatter: (params) => {
                        var text;
                        if (params.dataIndex == 1) {
                            text = '{f|  ' + params.data + '}';
                        } else if (params.dataIndex == 2) {
                            text = '{f|  ' + params.data + '}';
                        } else if (params.dataIndex == 3) {
                            text = '{f|  ' + params.data + '}';
                        } else {
                            text = '{f|  ' + params.data + '}';
                        }
                        return text;
                    },
                    rich: {
                        f: {
                            color: '#ccfff4',
                            fontSize: '22',
                        },
                    },
                    position: 'right',
                    padding: [0, 0, 0, -10],
                    show: true,
                },
            },
            data: getmyd,
            z: 77,
            animationEasing: 'elasticOut',
        },
    ],
};

3D柱状图+3个柱图+图例不能点击

// mock数据
const dataArr = {
    xdata: ['01.01', '01.02', '01.03', '01.04', '01.05', '01.06', '01.07'],
    vaccination: [1000, 1300, 1200, 800, 600, 700, 900],
    unvaccinated: [700, 800, 900, 500, 300, 400, 500],
    unvaccinatedTwo: [400, 300, 500, 200, 100, 100, 300],
    rateDataOne: [98, 96, 97, 92, 94, 95, 100],
    rateDataTwo: [88, 86, 87, 82, 84, 85, 95],
}
// tooltip
const tooltip = {
    trigger: "axis",
    textStyle: { fontSize: '100%' },
    formatter: params => {
        let rander = params.map(item => item.seriesType !== "pictorialBar" ? `<div>${item.seriesName}: ${item.seriesType !== "line" ? item.value : item.value + "%"}</div>` : '').join('')
        return `
            <div>${params[0].axisValue}</div>
            ${rander}
        `
    }
}
const legend = {
    data: ['应接种', '已完成第一次接种', '已完成第二次接种', '完成第一次接种率', '完成第二次接种率'],
    textStyle: { fontSize: 14, color: '#fff'},
    itemWidth: 25,
    itemHeight: 15,
    itemGap: 15,
    bottom: '5%',
    selectedMode: false
}
const grid = { top: '18%', left: '10%', right: '6%', bottom: '25%'}
// xAxis
const xAxis = {
    axisTick: { show: true },
    axisLine: { lineStyle: { color: 'rgba(255,255,255, .2)' } },
    axisLabel: { textStyle: { fontSize: 12, color: '#fff'  }, },
    data: dataArr.xdata
}
// yAxis
const yAxis = [{
    axisTick: { show: false },
    axisLine: { show: false, },
    splitLine: { lineStyle: { color: 'rgba(255,255,255, .05)' } },
    axisLabel: { textStyle: { fontSize: 16, color: '#fff' } }
},{
    show: true,
    max: 100,
    splitLine: { show:false },
    axisLine: { show: false },
    axisTick: { show: false },
    axisLabel: {
        textStyle: { fontSize: 16, color: '#fff' },
        formatter: params => {
            return `${params}%`
        }
    }
}]
// series
const series = [{
    z: 1,
    name: '上部1',
    type: 'pictorialBar',
    symbolPosition: 'end',
    data: dataArr.vaccination,
    symbol : 'diamond',
    symbolOffset: ['-50%', '-50%'],
    symbolSize: [29, 19],
    itemStyle: {
        borderColor: '#2fffa4',
        color: '#2fffa4'
    },
},{
    z: 1,
    type: 'bar',
    name: '应接种',
    barWidth: 30,
    barGap: '-50%',
    data: dataArr.vaccination,
    itemStyle: {
        color: {
            type: 'linear',
            x: 0, x2: 1, y: 0, y2: 0,
            colorStops: [
                { offset: 0, color: 'rgba(29, 245, 160, .7)' },
                { offset: 0.5, color: 'rgba(29, 245, 160, .7)' },
                { offset: 0.5, color: 'rgba(29, 245, 160, .3)' },
                { offset: 1, color: 'rgba(29, 245, 160, .3)' }
            ]
        }
    },
},{
    z: 2,
    name: '上部1',
    type: 'pictorialBar',
    symbolPosition: 'end',
    data: dataArr.unvaccinated,
    symbol : 'diamond',
    symbolOffset: [0, '-50%'],
    symbolSize: [29, 19],
    itemStyle: {
        borderColor: '#32ffee',
        color: '#32ffee'
    },
},{
    z: 2,
    type: 'bar',
    name: '已完成第一次接种',
    barWidth: 30,
    data: dataArr.unvaccinated,
    itemStyle: {
        color: {
            type: 'linear',
            x: 0, x2: 1, y: 0, y2: 0,
            colorStops: [
                { offset: 0, color: 'rgba(50, 255, 238, .7)' },
                { offset: 0.5, color: 'rgba(50, 255, 238, .7)' },
                { offset: 0.5, color: 'rgba(50, 255, 238, .3)' },
                { offset: 1, color: 'rgba(50, 255, 238, .3)' }
            ]
        }
    },
}, {
    z: 3,
    name: '上部1',
    type: 'pictorialBar',
    symbolPosition: 'end',
    data: dataArr.unvaccinatedTwo,
    symbol : 'diamond',
    symbolOffset: ['50%', '-50%'],
    symbolSize: [29, 19],
    itemStyle: {
        borderColor: '#ffd11a',
        color: '#ffd11a'
    },
},{
    z: 3,
    type: 'bar',
    name: '已完成第二次接种',
    barWidth: 30,
    data: dataArr.unvaccinatedTwo,
    itemStyle: {
        color: {
            type: 'linear',
            x: 0, x2: 1, y: 0, y2: 0,
            colorStops: [
                { offset: 0, color: 'rgba(255, 209, 26, .7)' },
                { offset: 0.5, color: 'rgba(255, 209, 26, .7)' },
                { offset: 0.5, color: 'rgba(255, 209, 26, .3)' },
                { offset: 1, color: 'rgba(255, 209, 26, .3)' }
            ]
        }
    },
}, {
    z: 9,
    yAxisIndex: 1,
    name: '完成第一次接种率', type: 'line',
    symbol: `path://M9.312,4.594 C12.074,4.594 14.313,6.832 14.313,9.594 C14.313,12.355 12.074,14.594 9.312,14.594 C6.551,14.594 4.312,12.355 4.312,9.594 C4.312,6.832 6.551,4.594 9.312,4.594 Z`,
    symbolSize: [10, 10],
    color: {
        type: 'linear',x: 1, y: 0, x2: 0, y2: 0,
        // 0% 处的颜色                           // 100% 处的颜色
        colorStops: [{ offset: 0, color: '#32ffee' }, { offset: 1, color: '#8afff5'}],
        global: false // 缺省为 false
    },
    lineStyle: { color: {
        type: 'linear',x: 1, y: 0, x2: 0, y2: 0,
        // 0% 处的颜色                           // 100% 处的颜色
        colorStops: [{ offset: 0, color: '#32ffee' }, { offset: 1, color: '#8afff5'}],
        global: false // 缺省为 false
    }},
    // 修改的是线下区域的颜色
    areaStyle: {
        color: new echarts.graphic.LinearGradient(
        // 右/下/左/上
        0, 0, 0, 1,[
            { offset: 0, color: 'rgba(50, 255, 238, .1)' },
            { offset: 1, color: 'transparent' }
        ])
    },
    label: {
        show: true,
        position: 'insideBottomLeft',
        formatter: params => {
            return `${params.value}%`
        },
        textStyle: { fontSize: 16, color: '#32ffee' }
    },
    data: dataArr.rateDataOne
}, {
    z: 9,
    yAxisIndex: 1,
    name: '完成第二次接种率', type: 'line',
    symbol: `path://M9.312,4.594 C12.074,4.594 14.313,6.832 14.313,9.594 C14.313,12.355 12.074,14.594 9.312,14.594 C6.551,14.594 4.312,12.355 4.312,9.594 C4.312,6.832 6.551,4.594 9.312,4.594 Z`,
    symbolSize: [10, 10],
    color: {
        type: 'linear',x: 1, y: 0, x2: 0, y2: 0,
        // 0% 处的颜色                           // 100% 处的颜色
        colorStops: [{ offset: 0, color: '#ffd11a' }, { offset: 1, color: '#fff5cc'}],
        global: false // 缺省为 false
    },
    lineStyle: { color: {
        type: 'linear',x: 1, y: 0, x2: 0, y2: 0,
        // 0% 处的颜色                           // 100% 处的颜色
        colorStops: [{ offset: 0, color: '#ffd11a' }, { offset: 1, color: '#fff5cc'}],
        global: false // 缺省为 false
    }},
    // 修改的是线下区域的颜色
    areaStyle: {
        color: new echarts.graphic.LinearGradient(
        // 右/下/左/上
        0, 0, 0, 1,[
            { offset: 0, color: 'rgba(255, 209, 26, .2)' },
            { offset: 1, color: 'transparent' }
        ])
    },
    label: {
        show: true,
        position: 'insideBottomRight',
        formatter: params => {
            return `${params.value}%`
        },
        textStyle: { fontSize: 16, color: '#ffd11a' }
    },
    data: dataArr.rateDataTwo
}]
option = { tooltip, xAxis, yAxis, series, grid, legend, backgroundColor: 'rgba(0, 0, 0, .7)' }

3D圆筒柱状图
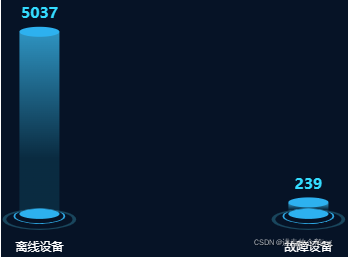
xData = ["正常设备", "报警设备", "离线设备", "故障设备"];
yData = [14350, 298, 5037, 239];
option = {
    backgroundColor: '#061326',
    "grid": {
        "top": "25%",
        "left": "-5%",
        "bottom": "5%",
        "right": "5%",
        "containLabel": true
    },
    tooltip: {
        show: true
    },
    animation: false,
    "xAxis": [{
        "type": "category",
        "data": xData,
        "axisTick": {
            "alignWithLabel": true
        },
        "nameTextStyle": {
            "color": "#82b0ec"
        },
        "axisLine": {
            show: false,
            "lineStyle": {
                "color": "#82b0ec"
            }
        },
        "axisLabel": {
            "textStyle": {
                "color": "#fff"
            },
            margin: 30
        }
    }],
    "yAxis": [{
        show: false,
        "type": "value",
        "axisLabel": {
            "textStyle": {
                "color": "#fff"
            },
        },
        "splitLine": {
            "lineStyle": {
                "color": "#0c2c5a"
            }
        },
        "axisLine": {
            "show": false
        }
    }],
    "series": [{
            "name": "",
            type: 'pictorialBar',
            symbolSize: [40, 10],
            symbolOffset: [0, -6],
            symbolPosition: 'end',
            z: 12,
            // "barWidth": "0",
            "label": {
                "normal": {
                    "show": true,
                    "position": "top",
                    // "formatter": "{c}%"
                    fontSize: 15,
                    fontWeight: 'bold',
                    color: '#34DCFF'
                }
            },
            color: "#2DB1EF",
            data: yData
        },
        {
            name: '',
            type: 'pictorialBar',
            symbolSize: [40, 10],
            symbolOffset: [0, 7],
            // "barWidth": "20",
            z: 12,
            "color": "#2DB1EF",
            "data": yData
        },
        {
            name: '',
            type: 'pictorialBar',
            symbolSize: [50, 15],
            symbolOffset: [0, 12],
            z: 10,
            itemStyle: {
                normal: {
                    color: 'transparent',
                    borderColor: '#2EA9E5',
                    borderType: 'solid',
                    borderWidth: 1
                }
            },
            data: yData
        },
        {
            name: '',
            type: 'pictorialBar',
            symbolSize: [70, 20],
            symbolOffset: [0, 18],
            z: 10,
            itemStyle: {
                normal: {
                    color: 'transparent',
                    borderColor: '#19465D',
                    borderType: 'solid',
                    borderWidth: 2
                }
            },
            data: yData
        },
        {
            type: 'bar',
            //silent: true,
            "barWidth": "40",
            barGap: '10%', // Make series be overlap
            barCateGoryGap: '10%',
            itemStyle: {
                normal: {
                    color: new echarts.graphic.LinearGradient(0, 0, 0, 0.7, [{
                            offset: 0,
                            color: "#38B2E6"
                        },
                        {
                            offset: 1,
                            color: "#0B3147"
                        }
                    ]),
                    opacity: .8
                },
            },
            data: yData
        }
    ]
};

3D圆筒柱状图+背景
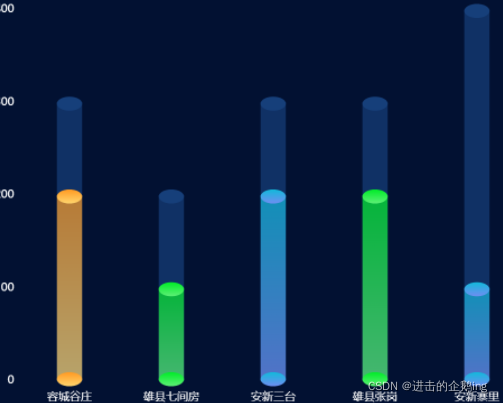
var xData2 = ["容城谷庄","雄县七间房","安新三台","雄县张岗","安新寨里"];
var data1 = [200,100,200,200,100];
var data2 = [300,200,300,300,400];
option = {
    backgroundColor: '#021132',
    tooltip: {
        trigger: 'item',
    },
    grid:{
        left:100,
        bottom:100
    },
    xAxis: {
        data: xData2,
        axisTick: {
            show: false
        },
        axisLine: {
            show: false
        },
        axisLabel: {
            interval:0,
            textStyle: {
                color: '#fff',
                fontSize:20,
            },
            margin: 20, //刻度标签与轴线之间的距离。
        },
    },
    yAxis: {
        splitLine: {
            show: false,
        },
        axisTick: {
            show: false
        },
        axisLine: {
            show: false
        },
        axisLabel: {
            textStyle: {
                color: '#fff',
                fontSize:20,
            },
        }
    },
    series: [
            {//三个最低下的圆片
                "name": "",
                "type": "pictorialBar",
                "symbolSize": [45, 25],
                "symbolOffset": [0, 10],
                "z": 12,
                itemStyle:{
                    opacity:1,
                    color: function(params){
                        var a = params.name.slice(0,2);
                        if(a === '容城'){
                            return new echarts.graphic.LinearGradient(0, 0, 0, 1, [{
                                offset: 0,
                                color: '#FF9A22' // 0% 处的颜色
                            }, {
                                offset: 1,
                                color:  '#FFD56E'// 100% 处的颜色
                            }], false)
                        }else if(a === '雄县' || a === '雄州'){
                            return new echarts.graphic.LinearGradient(0, 0, 0, 1, [{
                                offset: 0,
                                color: '#00EC28' // 0% 处的颜色
                            }, {
                                offset: 1,
                                color:  '#5DF076'// 100% 处的颜色
                            }], false)
                        }else if(a === '安新'){
                            return new echarts.graphic.LinearGradient(0, 0, 0, 1, [{
                                offset: 0,
                                color: '#12B9DB' // 0% 处的颜色
                            }, {
                                offset: 1,
                                color:  '#6F8EF2'// 100% 处的颜色
                            }], false)
                        }
                    }
                },
                "data": [1,1,1,1,1]
            },

            //下半截柱状图
            {
                name: '2020',
                type: 'bar',
                barWidth: 45,
                barGap: '-100%',
                itemStyle: {//lenged文本
                    opacity:.7,
                    color: function(params){
                        var a = params.name.slice(0,2);
                        if(a === '容城'){
                            return new echarts.graphic.LinearGradient(0, 0, 0, 1, [{
                                offset: 0,
                                color: '#FF9A22' // 0% 处的颜色
                            }, {
                                offset: 1,
                                color:  '#FFD56E'// 100% 处的颜色
                            }], false)
                        }else if(a === '雄县' || a === '雄州'){
                            return new echarts.graphic.LinearGradient(0, 0, 0, 1, [{
                                offset: 0,
                                color: '#00EC28' // 0% 处的颜色
                            }, {
                                offset: 1,
                                color:  '#5DF076'// 100% 处的颜色
                            }], false)
                        }else if(a === '安新'){
                            return new echarts.graphic.LinearGradient(0, 0, 0, 1, [{
                                offset: 0,
                                color: '#12B9DB' // 0% 处的颜色
                            }, {
                                offset: 1,
                                color:  '#6F8EF2'// 100% 处的颜色
                            }], false)
                        }
                    }
                },
                data: data1
            },
            { // 替代柱状图 默认不显示颜色,是最下方柱图(邮件营销)的value值 - 20
                type: 'bar',
                barWidth: 45,
                barGap: '-100%',
                stack: '广告',
                itemStyle: {
                    color: 'transparent'
                },
                data: data1
            },
            {
                "name": "", //头部
                "type": "pictorialBar",
                "symbolSize": [45, 25],
                "symbolOffset": [0, -10],
                "z": 12,
                "symbolPosition": "end",
                itemStyle:{
                    color:'#163F7A',
                    opacity:1,
                },
                "data": data2
            },
            {
                "name": "",
                "type": "pictorialBar",
                "symbolSize": [45, 25],
                "symbolOffset": [0, -10],
                "z": 12,
                itemStyle:{
                    opacity:1,
                    color: function(params){
                        var a = params.name.slice(0,2);
                        if(a === '容城'){
                            return new echarts.graphic.LinearGradient(0, 0, 0, 1, [{
                                offset: 0,
                                color: '#FF9A22' // 0% 处的颜色
                            }, {
                                offset: 1,
                                color:  '#FFD56E'// 100% 处的颜色
                            }], false)
                        }else if(a === '雄县' || a === '雄州'){
                            return new echarts.graphic.LinearGradient(0, 0, 0, 1, [{
                                offset: 0,
                                color: '#00EC28' // 0% 处的颜色
                            }, {
                                offset: 1,
                                color:  '#5DF076'// 100% 处的颜色
                            }], false)
                        }else if(a === '安新'){
                            return new echarts.graphic.LinearGradient(0, 0, 0, 1, [{
                                offset: 0,
                                color: '#12B9DB' // 0% 处的颜色
                            }, {
                                offset: 1,
                                color:  '#6F8EF2'// 100% 处的颜色
                            }], false)
                        }
                    }
                },
                "symbolPosition": "end",
                "data": data1
            },
            {
                name: '2019',
                type: 'bar',
                barWidth: 45,
                barGap: '-100%',
                z:0,
                itemStyle: {
                    color: '#163F7A',
                    opacity:.7,
                },
                data: data2
            }

        ]
};

电池图
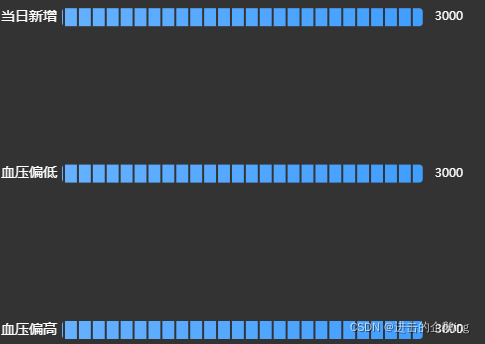
var  category= [{
         name: "血糖偏高",
        value: 2500
    },
    {
        name: "血糖偏低",
        value: 8000
    },
    {
        name: "血压偏高",
        value: 3000
    },
    {
        name: "血压偏低",
        value: 3000
    },
    {
        name: "当日新增",
        value: 3000
    }
]; // 类别
var  datas = [];
category.forEach(value => {
    datas.push(value.value);
});
option = {
    backgroundColor:'#333',
    xAxis: {
        splitLine: {
            show: false
        },
        axisLine: {
            show: false
        },
        axisLabel: {
            show: false
        },
        axisTick: {
            show: false
        }
    },
    grid: {
        left: 80,
        top: 20, // 设置条形图的边距
        right: 80,
        bottom: 20
    },
    yAxis: [{
        type: "category",
        inverse: false,
        data: category,
        axisLine: {
            show: false
        },
        axisTick: {
            show: false
        },
        axisLabel: {
            show: false
        }
    }],
    series: [{
            // 内
            type: "bar",
            barWidth: 18,
            legendHoverLink: false,
            silent: true,
            itemStyle: {
                normal: {
                    barBorderRadius:[4,4,4,4],
                    color: function(params) {
                        var color;
                        if(params.dataIndex==19){
                             color = {
                                type: "linear",
                                x: 0,
                                y: 0,
                                x2: 1,
                                y2: 0,
                                colorStops: [{
                                        offset: 0,
                                        color: "#66b1ff" // 0% 处的颜色
                                    },
                                    {
                                        offset: 1,
                                        color: "#409eff" // 100% 处的颜色
                                    }
                                ]
                            }
                            }else if(params.dataIndex==18){
                            color = {
                                type: "linear",
                                x: 0,
                                y: 0,
                                x2: 1,
                                y2: 0,
                                colorStops: [{
                                         offset: 0,
                                        color: "#66b1ff" // 0% 处的颜色
                                    },
                                    {
                                        offset: 1,
                                        color: "#409eff" // 100% 处的颜色
                                    }
                                ]
                            }
                            }else if(params.dataIndex==17){
                            color = {
                                type: "linear",
                                x: 0,
                                y: 0,
                                x2: 1,
                                y2: 0,
                                colorStops: [{
                                         offset: 0,
                                        color: "#66b1ff" // 0% 处的颜色
                                    },
                                    {
                                        offset: 1,
                                        color: "#409eff" // 100% 处的颜色
                                    }
                                ]
                            }
                            }else{
                            color = {
                                type: "linear",
                                x: 0,
                                y: 0,
                                x2: 1,
                                y2: 0,
                                colorStops: [{
                                         offset: 0,
                                        color: "#66b1ff" // 0% 处的颜色
                                    },
                                    {
                                        offset: 1,
                                        color: "#409eff" // 100% 处的颜色
                                    }
                                ]
                            }
                            }
                            return color;
                    },
                }
            },
            label: {
                normal: {
                    show: true,
                    position: "left",
                    formatter: "{b}",
                    textStyle: {
                        color: "#fff",
                        fontSize: 14
                    }
                }
            },
            data: category,
            z: 1,
            animationEasing: "elasticOut"
        },
        {
            // 分隔
            type: "pictorialBar",
            itemStyle: {
                normal:{
                    color:"#333"
                }
            },
            symbolRepeat: "fixed",
            symbolMargin: 6,
            symbol: "rect",
            symbolClip: true,
            symbolSize: [2, 21],
            symbolPosition: "start",
            symbolOffset: [1, -1],
            data: category,
            z: 2,
            animationEasing: "elasticOut"
        },
        {
            // 外边框
            type: "pictorialBar",
            symbol: "rect",
            itemStyle: {
                normal: {
                    color: "none"
                }
            },
            label: {
                normal: {
                	formatter: (params) => {
                		var text;
                        if(params.dataIndex==1){
                        	text = '{f|  '+params.data+'}';
                        }else if(params.dataIndex==2){
                        	text = '{f|  '+params.data+'}';
                        }else if(params.dataIndex==3){
                        	text = '{f|  '+params.data+'}';
                        }else{
                        	text = '{f|  '+params.data+'}';
                        }
                        return text;
    				},
    				rich:{
    					f:{
    			        	color:"#ffffff"
    			        }
    				},
    				position: 'right',
    				show: true
                }
            },
            data: datas,
            z: 0,
            animationEasing: "elasticOut"
        }
    ]
};

自动播放+底部可拖拽
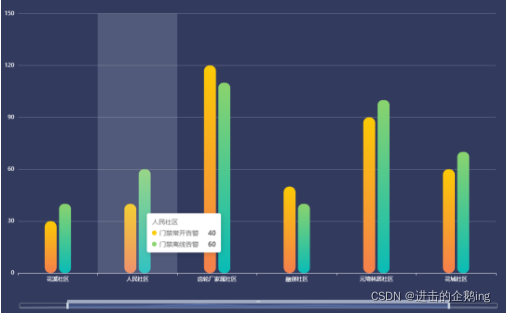
 var option = {
     title: {
        text: '门禁告警数量',
        textStyle: {
            fontSize: 25,
            fontWeight: 'normal',
            color: '#fff',
        },
        x: 'center'
    },
     backgroundColor:'#323a5e',
        tooltip: {
          trigger: 'axis',
          axisPointer: { // 坐标轴指示器,坐标轴触发有效
            type: 'shadow' // 默认为直线,可选为:'line' | 'shadow'
          }
        },
        grid: {
          left: '2%',
          right: '4%',
          bottom: '14%',
          top:'16%',
          containLabel: true
        },
         legend: {
        data: ['门禁常开告警', '门禁离线告警'],
        right: 10,
        top:12,
        textStyle: {
            color: "#fff"
        },
        itemWidth: 12,
        itemHeight: 10,
        // itemGap: 35
    },
        xAxis: {
          type: 'category',
          data: ['万城社区','花溪社区','人民社区','齿轮厂家属社区','融创社区','元琦林居社区','花城社区','杨中村'],
          axisLine: {
            lineStyle: {
              color: 'white'
            }
          },
          axisLabel: {
            // interval: 0,
            // rotate: 40,
            textStyle: {
              fontFamily: 'Microsoft YaHei'
            }
          },
        },
        yAxis: {
          type: 'value',
          max:'150',
          axisLine: {
            show: false,
            lineStyle: {
              color: 'white'
            }
          },
          splitLine: {
            show: true,
            lineStyle: {
              color: 'rgba(255,255,255,0.3)'
            }
          },
          axisLabel: {}
        },
        "dataZoom": [{
          "show": true,
          "height": 12,
          "xAxisIndex": [
            0
          ],
          bottom:'8%',
          "start": 10,
          "end": 90,
          handleIcon: 'path://M306.1,413c0,2.2-1.8,4-4,4h-59.8c-2.2,0-4-1.8-4-4V200.8c0-2.2,1.8-4,4-4h59.8c2.2,0,4,1.8,4,4V413z',
          handleSize: '110%',
          handleStyle:{
            color:"#d3dee5",
          },
          textStyle:{
            color:"#fff"},
          borderColor:"#90979c"
        }, {
          "type": "inside",
          "show": true,
          "height": 15,
          "start": 1,
          "end": 35
        }],
        series: [{
          name: '门禁常开告警',
          type: 'bar',
          barWidth: '15%',
          itemStyle: {
            normal: {
                color: new echarts.graphic.LinearGradient(0, 0, 0, 1, [{
                    offset: 0,
                    color: '#fccb05'
                }, {
                    offset: 1,
                    color: '#f5804d'
                }]),
                barBorderRadius: 12,
            },
          },
          data: [10, 30, 40, 120, 50, 90, 60, 40, 15]
        },
        {
          name: '门禁离线告警',
          type: 'bar',
          barWidth: '15%',
          itemStyle: {
            normal: {
                color: new echarts.graphic.LinearGradient(0, 0, 0, 1, [{
                    offset: 0,
                    color: '#8bd46e'
                }, {
                    offset: 1,
                    color: '#09bcb7'
                }]),
                barBorderRadius: 11,
            }
          },
          data: [5, 40, 60, 110, 40, 100, 70, 50 ,20]
        }]
      };
      var app = {
        currentIndex: -1,
      };
      setInterval(function () {
        var dataLen = option.series[0].data.length;
        // 取消之前高亮的图形
        myChart.dispatchAction({
          type: 'downplay',
          seriesIndex: 0,
          dataIndex: app.currentIndex
        });
        app.currentIndex = (app.currentIndex + 1) % dataLen;
        //console.log(app.currentIndex);
        // 高亮当前图形
        myChart.dispatchAction({
          type: 'highlight',
          seriesIndex: 0,
          dataIndex: app.currentIndex,
        });
        // 显示 tooltip
        myChart.dispatchAction({
          type: 'showTip',
          seriesIndex: 0,
          dataIndex: app.currentIndex
        });

      }, 1000);

比电池图好看一点的进度条

let backgroundColor = 'rgba(0,0,0,1)';
let chartData = [
    [0,20,333, 0],
    ['AAA', 'BBB', 'CCC', 'DDD'],
];
let getmydmc = chartData[1]; //数据点名称
let getmyd = chartData[0]; //收入金额
let getmydzd = [];
let big = 0;
getmyd.forEach((el) => {
    if (!(el === undefined || el === '' || el === 0)) {
        if (big < Number(el)) {
            big = Number(el);
        }
    } else {
        big = 100;
    }
});
for (let i = 0; i < getmyd.length; i++) {
    getmydzd.push(big * 4);
}
//计算最大值
function calMax(arr) {
    let max = 0;
    arr.forEach((el) => {
        el.forEach((el1) => {
            if (!(el1 === undefined || el1 === '' || el1 === 0)) {
                if (max < Number(el1)) {
                    max = Number(el1);
                }
            } else {
                max == 100;
            }
        });
    });
    let maxint = Math.ceil(max / 9.5);
    //不让最高的值超过最上面的刻度
    let maxval = maxint * 10;
    //让显示的刻度是整数
    return maxval;
}
const max = Math.ceil(calMax([getmyd]) / 10) * 10;
option = {
    backgroundColor: backgroundColor,
    grid: {
        left: '10%',
        right: '10%',
        bottom: '0%',
        top: '5%',
        // containLabel: true,
    },
    tooltip: {
        formatter: (params) => {
            if (params.name !== '') {
                return params.name + ' : ' + getmyd[params.dataIndex];
            }
        },
        textStyle: {
            align: 'left',
        },
    },
    xAxis: [
        {
            type: 'value',
            axisLabel: {
                show: false,
                color: '#fff',
                formatter: function (val) {
                    return val + '';
                },
                textStyle: {
                    fontSize: '13',
                },
            },
            min: 0,
            max: max, // 计算最大值
            interval: max / 5, //  平均分为5份
            splitNumber: 5,
            splitLine: {
                show: false,
                lineStyle: {
                    color: '#fff',
                },
            },
            axisLine: {
                show: false,
                lineStyle: {
                    color: '#fff',
                    width: 1,
                    opacity: 0.3,
                },
            },
            axisTick: {
                show: false,
            },
        },
        {
            type: 'value',
            axisLabel: {
                show: false,
            },
            min: 0,
            max: max, // 计算最大值
            interval: max / 10, //  平均分为5份
            splitNumber: 10,
            splitLine: {
                show: false,
                lineStyle: {
                    type: 'dashed',
                    color: '#D8D8D8',
                },
            },
            axisLine: {
                show: false,
                lineStyle: {
                    color: '#fff',
                },
            },
            axisTick: {
                show: false,
            },
        },
    ],
    yAxis: [
        {
            inverse: false,
            data: getmydmc,
            axisLabel: {
                padding: [0, 0, 20, -10],
                inside: true,
                textStyle: {
                    fontSize: 14,
                    fontFamily: 'PingFang SC',
                    fontWeight: 400,
                    color: '#d2d2d2',
                    align: 'left',
                    textShadowColor: '#00d6ff',
                    textShadowOffsetX: 0,
                    textShadowOffsetY: 0,
                    textShadowBlur: 5,
                },
                formatter: '{value}\n{a|占位}',
                rich: {
                    a: {
                        color: 'transparent',
                        lineHeight: 30,
                        fontFamily: 'digital',
                        fontSize: 14,
                    },
                },
            },
            // offset: 0,
            splitLine: {
                show: false,
            },
            axisTick: {
                show: false,
            },
            axisLine: {
                show: false,
            },
        },
        {
            //左侧柱状图的Y轴
            gridIndex: 0, //y轴所在的 grid 的索引
            splitLine: 'none',
            axisTick: 'none',
            axisLine: 'none',
            data: getmyd,
            inverse: false,
            axisLabel: {
                show: true,
                verticalAlign: 'bottom',
                align: 'right',
                padding: [0, 10, 18, 0],
                textStyle: {
                    color: '#fff',
                    fontSize: '14',
                },
                formatter: function (value) {
                    return '{x|' + value + '}';
                    // return '{x|' + value + '}  {y|' + '%}';
                },
                rich: {
                    y: {
                        color: '#3dffef',
                        fontFamily: 'Orbitron',
                        fontSize: 14,
                    },
                    x: {
                        color: '#3dffef',
                        fontFamily: 'Orbitron',
                        fontSize: 14,
                    },
                },
            },
        },
    ],
    dataZoom: [
        {
            type: 'inside',
            show: true,
            height: 15,
            start: 1,
            end: 100,
            orient: 'vertical',
            zlevel: 66,
        },
    ],
    series: [
        {
            name: '值',
            type: 'bar',
            // barGap: '100%',
            padding: 10,
            // zlevel: 1,
            xAxisIndex: 0,
            label: {
                show: false,
                position: 'right',
                textStyle: {
                    color: '#fff',
                    fontSize: 14,
                },
            },
            itemStyle: {
                normal: {
                    borderRadius: 0,
                    color: {
                        colorStops: [
                            {
                                offset: 0,
                                color: '#46B7ED', // 0% 处的颜色
                            },
                            {
                                offset: 1,
                                color: '#48EDD3', // 100% 处的颜色
                            },
                        ],
                    },
                },
            },
            barWidth: 18,
            data: getmyd,
            z: 0,
        },
        {
            // 分隔
            type: 'pictorialBar',
            symbolRotate: '-25',
            itemStyle: {
                normal: {
                    color: 'rgba(1, 12, 38, 0.4)',
                },
            },
            symbolRepeat: 'fixed',
            symbolMargin: 6,
            symbol: 'rect',
            symbolClip: true,
            symbolSize: [5, 22],
            symbolPosition: 'start',
            symbolOffset: [0, -2],
            data: getmyd,
            z: 66,
            animationEasing: 'elasticOut',
        },
        {
            name: '背景',
            type: 'bar',
            barWidth: 24,
            barGap: '-118%',
            data: getmydzd,
            itemStyle: {
                normal: {
                    color: 'rgba(5,59,113,0.7)',
                    borderRadius: 0,
                    // borderColor: 'rgba(0, 255, 236, 1)',
                    borderColor: new echarts.graphic.LinearGradient(
                        0,
                        0,
                        0,
                        1,
                        [
                            {
                                offset: 0,
                                color: '#015EFE', // 0% 处的颜色
                            },
                            {
                                offset: 1,
                                color: '#10C2E8', // 100% 处的颜色
                            },
                        ],
                        false
                    ),
                },
            },
            z: -1,
        },
        {
            type: 'pictorialBar',
            name: '左内边框',
            symbol: 'rect',
            symbolSize: [3, 22],
            symbolOffset: [0, -2],
            animation: false,
            // symbolKeepAspect: true,
            // animationEasing: 'none',
            itemStyle: {
                normal: {
                    color: 'rgba(5,59,113,1)',
                },
                opacity: 1,
            },
            z: 99,
            data: new Array(getmyd.length).fill(1),
        },
    ],
};

总结

本篇文章就到这里了,希望能够给你带来帮助,也希望您能够多多关注我们的更多内容!

(0)

相关推荐

  • vue+echarts实现堆叠柱状图

    本文实例为大家分享了vue+echarts实现堆叠柱状图的具体代码,供大家参考,具体内容如下 echarts-子组件 <template> <div class="chart" ref="chartEle"></div> </template> <script> import echarts from "echarts"; import eventBus from '@/componen

  • vue+echart实现双柱状图

    本文实例为大家分享了vue+echart实现双柱状图的具体代码,供大家参考,具体内容如下 效果图: 一.安装 版本号建议安装"echarts": "^4.8.0",其它版本init会报错 1. 首先需要安装echarts依赖包 npm install --save echarts@4.8.0 2. 或者使用国内的淘宝镜像: npm install -g cnpm --registry=https://registry.npm.taobao.org <templ

  • vue echarts实现横向柱状图

    本文实例为大家分享了vue echarts实现横向柱状图的具体代码,供大家参考,具体内容如下 实现效果: 代码: <template> <div class="OverYearsPompany"> <div id="OverYearsPompanyChart" style="flex: 1; height: 368px; margin-top: -42px"></div> </div>

  • vue+echarts实现进度条式柱状图

    本文实例为大家分享了vue+echarts实现进度条式柱状图的具体代码,供大家参考,具体内容如下 效果图如下 代码: <template> <div class="content-page"> <div class="tab-content"> <div id="myChart1"></div> </div> </div> </template> &l

  • 详解vue使用Echarts画柱状图

    目录 1 引入Echarts 1.1 安装 1.2 引入 2 基本柱状图 3 多列柱状图 4 柱状图样式设置 4.1 柱条样式 4.2 柱条间距 5 动态排序柱状图 6 总结 1 引入Echarts 1.1 安装 使用如下命令通过 npm 安装 ECharts npm install echarts --save 注:本文安装Echarts版本为:“echarts”: “5.2.1” 1.2 引入 安装完成以后,可以将echarts全部引入,这样一来,我们可以在该页面使用echarts所有组件:

  • vue echarts实现柱状图动态展示

    本文实例为大家分享了vue echarts实现柱状图动态展示的具体代码,供大家参考,具体内容如下 轮播图形式展现 <template> <div class="dan"> <div id="scalesize" :style="{width: '100%', height: '100%'}"></div> </div> </template> <script> i

  • Vue echart实现柱状图,电池图,3D柱图和3D圆柱图代码详解

    目录 电池图 3D柱状图+3个柱图+图例不能点击 3D圆筒柱状图 3D圆筒柱状图+背景 电池图 自动播放+底部可拖拽 比电池图好看一点的进度条 总结 电池图 let backgroundColor = 'rgba(0,0,0,1)'; let chartdata = [ [111, 222, 333, 444], ['石油', '煤矿', '汽油', '电力'], ]; var getmydmc = chartdata[1]; //数据点名称 var getmyd = chartdata[0];

  • 使用Vue.observable()进行状态管理的实例代码详解

    随着组件的细化,就会遇到多组件状态共享的情况, Vuex当然可以解决这类问题,不过就像 Vuex官方文档所说的,如果应用不够大,为避免代码繁琐冗余,最好不要使用它,今天我们介绍的是 vue.js 2.6 新增加的 Observable API ,通过使用这个 api 我们可以应对一些简单的跨组件数据状态共享的情况. 先看下官网描述,如下图 observable()方法,用于设置监控属性,这样就可以监控viewModule中的属性值的变化,从而就可以动态的改变某个元素中的值,监控属性的类型不变量而

  • vue 下列表侧滑操作实例代码详解

    由于是上线的项目且已经按照数据逻辑去渲染了能看懂的看逻辑吧.有点多 效果如图 <template> <div class="lottery-management-wrapper"> <ul> <li class="lottery-management-list-wrapper"> <div class="lottery-management-list" v-for="(item ,

  • vue实现网络图片瀑布流 + 下拉刷新 + 上拉加载更多(步骤详解)

    一.思路分析和效果图 用vue来实现一个瀑布流效果,加载网络图片,同时有下拉刷新和上拉加载更多功能效果.然后针对这几个效果的实现,捋下思路: 根据加载数据的顺序,依次追加标签展示效果: 选择哪种方式实现瀑布流,这里选择绝对定位方式: 关键问题:由于每张图片的宽高不一样,而瀑布流中要求所有图片的宽度一致,高度随宽度等比缩放.而且由于图片的加载是异步延迟.在不知道图片高度的情况下,每个图片所在的item盒子不好绝对定位.因此在渲染页面前先获取所有图片的高度,是解决问题的关键点!这里选择用JS中的Im

  • Java图形化界面设计之容器(JFrame)详解

    Java图形化界面设计--容器(JFrame) 程序是为了方便用户使用的,因此实现图形化界面的程序编写是所有编程语言发展的必然趋势,在命令提示符下运行的程序可以让我们了解java程序的基本知识体系结构,现在就进入java图形化界面编程. 一.Java基本类(JFC) Java基本类("JavaFoundationClasses",JFC),由一些软件包组成.这些软件包主要包括下面一些应用程序接口(API): ·抽象窗口工具集(AWT)(1.1及以上版本). ·Swing构件. ·Jav

  • Vue.js实现可配置的登录表单代码详解

    表单是后台项目业务中的常用组件,这次重构了登录功能以满足登录方式可配置的需求,在此记录和分享一下. 业务场景 在之前,项目只支持手机号+密码登录,前端是直接把表单写死的,后来有客户希望能支持验证码登录,有的客户还希望能有手机号+验证码+密码的登录方式-所以登录方式的灵活性需要可配置的表单支持,于是我把登录组件做了拆分. 以表单元素为粒度,分离出了手机号.密码.短信验证码这几个组件,它们内部都有自己的表单验证方法,通过组合可以快速完成登录.注册.找回密码等表单组件.高内聚低耦合.高内聚低耦合-跟着

  • Vue创建头部组件示例代码详解

    Vue.js 组件 组件(Component)是 Vue.js 最强大的功能之一. 组件可以扩展 HTML 元素,封装可重用的代码. 具体代码如下所示: <!DOCTYPE html> <html> <head> <meta charset="utf-8" /> <meta http-equiv="X-UA-Compatible" content="IE=edge"> <title

  • vue 地图可视化 maptalks 篇实例代码详解

    Maptalks 项目是一个 HTML5 的地图引擎, 基于原生 ES6 Javascript 开发: - 二三维一体化地图, 通过二维地图的旋转 /倾斜增加三维视角 - 插件化设计, 能与其他图形库结合, 开发各种二三维效果, 例如 echarts/d3/THREE 等 - 很认真的优化了绘制性能 - 很重视测试, 有接近 1.5K 个单元测试用例, 所以稳定性还不错, 已经应用在很多大大小小的系统上了 上面是一段 maptalks 官方介绍,下面来创建工程.首先利用 vue-cli3 搭建一

  • laravel-admin 与 vue 结合使用实例代码详解

    由于 Laravel-admin 采用的是 pjax 的方式刷新页面,意味着很多页面刷新的操作,并不是刷新整个 document,而是从服务器拿到部分 document,再通过类似 $("#pjax-container").html(newPart) 的方式更新的. 这就造成一个问题,每次 pjax 刷新,都会破坏 vue 的 dom 映射. 所以理论上有2种方法解决: 重新绑定一下 vue 的映射关系 在某些页面禁止 pjax 1 太难搞,而且没啥资料,放弃.2 的话比较可行. 部分

  • vue通信方式EventBus的实现代码详解

    vue通信方式有很多,项目中用的比较多的的有 pros.vuex.$emit/$on 这3种,还有 provide/inject (适合高阶组件). $attrs和$listeners (适合高阶组件)以及 $parent/$child/ref.eventBus 等这3种方式.很多时候我们都是只会使用api,而懂得原理以及实现,但我就觉得懂得原理以及实现跟一个只会调用api的开发人员时不在同一层次的.所以这里就像把跨组件通信的 eventBus 通信的原理给大家展示一下.这也是自己学到大佬的的东

随机推荐