python中seaborn包常用图形使用详解
seaborn包是对matplotlib的增强版,需要安装matplotlib后才能使用。
所有图形都用plt.show()来显示出来,也可以使用下面的创建画布
fig,ax=plt.subplots()  #一个画布

fig,(ax1,ax2) = plt.subplots( ncols=2)  #两个画布
1)单个特征统计图countplot
sn.countplot(train.mnth)#离散型特征可使用,描述样本点出现的次数。

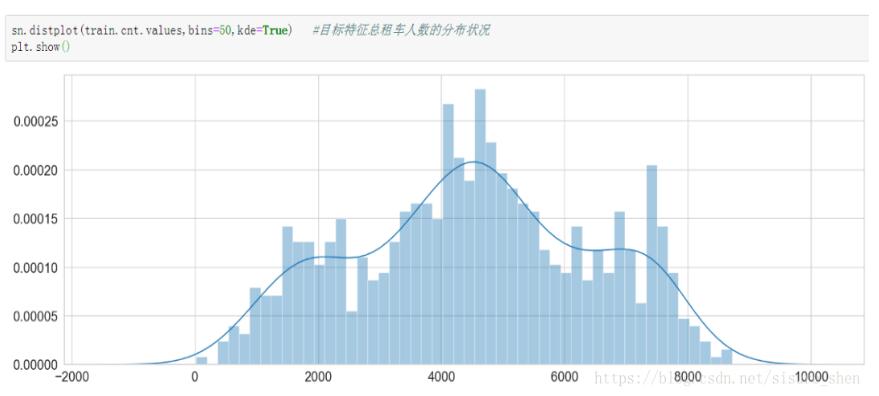
2)单个特征统计图distplot
sn.distplot(train.cnt.values,bins=50,kde=True)#连续型特征可使用,bins=50分成50个柱形,kde=True显示核密度线。如果图形的尾巴很特殊,则可能是奇异点(离群点,噪声点),考虑去掉。

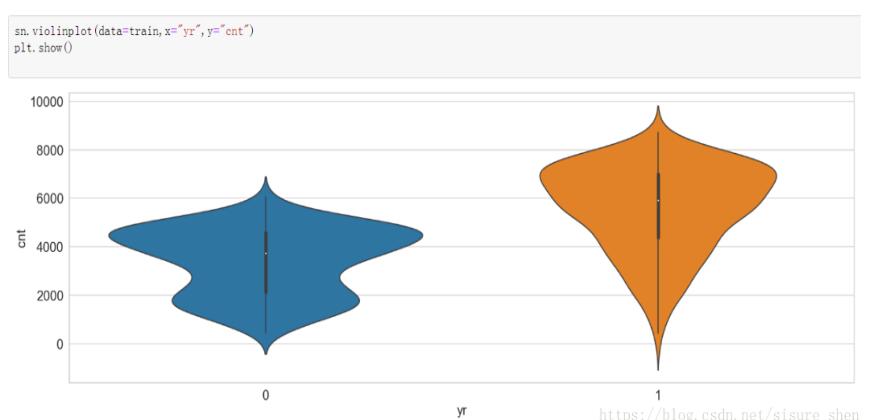
3)双特征小提琴图
sn.violinplot(data=train[['yr', 'cnt']],x="yr",y="cnt") #显示数据分布及其概率密度,中间的黑色粗条表示四分位数范围,从其延伸的幼细黑线代表 95% 置信区间,而白点则为中位数。

4)双特征箱型图
sn.boxplot(data=train,x="yr",y="cnt")#又称为盒须图、盒式图或箱线图,是一种用作显示一组数据分散情况资料的统计图。它显示情况从上到下的顺序为:异常值(可能没有)、最大值、上四分位数、中位数、下四分位数、最小值、异常值(有时没有,如果有,要特别注意)。

5)双特征棒图
fig,(ax1,ax2) = plt.subplots(ncols=2) #一个画布,两个轴

sn.barplot(data=train,x='holiday',y='cnt',hue='weathersit',ax=ax1) #hue='weathersit',通过weathersit来区分

sn.barplot(data=train,x='workingday',y='cnt',hue='season',ax=ax2) #hue='season',通过season来区分

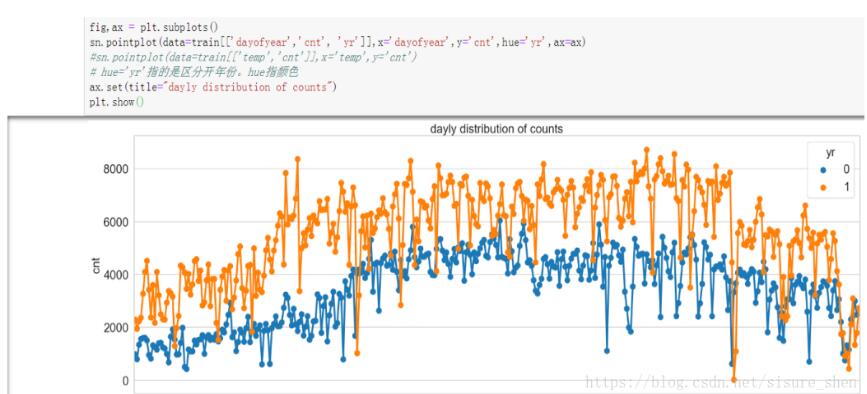
6)双特征折线图
fig,ax = plt.subplots()

sn.pointplot(data=train[['dayofyear','cnt', 'yr']],x='dayofyear',y='cnt',hue='yr',ax=ax)

# hue='yr'指的是区分开年份。hue指颜色

ax.set(title="dayly distribution of counts")

plt.show()

7)关系热力图
corrMatt = train[["temp","atemp","hum","windspeed","cnt"]].corr()

mask = np.array(corrMatt)

mask[np.tril_indices_from(mask)] = False

sn.heatmap(corrMatt, mask=mask,

      vmax=1, square=True,annot=True)

plt.show()

8)双特征散点图
sn.scatterplot(x=train.GrLivArea,y=train.SalePrice)

plt.title("Looking for outliers") #图形标题

plt.show()

以上这篇python中seaborn包常用图形使用详解就是小编分享给大家的全部内容了,希望能给大家一个参考,也希望大家多多支持我们。
赞 (0)

