Vue+Openlayer批量设置闪烁点的实现代码(基于postrender机制)

效果图:
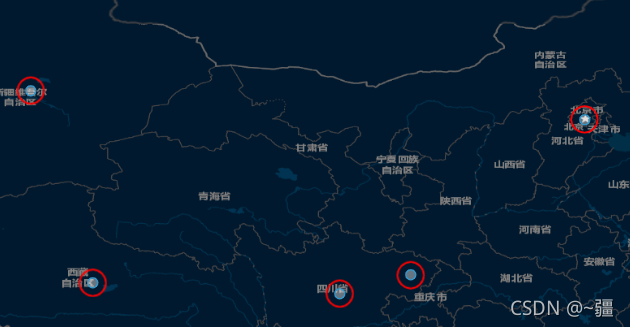
实现代码:

<template>
  <div id="map" style="width: 100vw; height: 100vh" />
</template>
<script>
import "ol/ol.css";
import TileLayer from "ol/layer/Tile";
import VectorLayer from "ol/layer/Vector";
import VectorSource from "ol/source/Vector";
import XYZ from "ol/source/XYZ";
import { Map, View, Feature } from "ol";
import { Style, Circle, Stroke } from "ol/style";
import { Point } from "ol/geom";
import { getVectorContext } from "ol/render";

// 边界json数据
export default {
  data() {
    return {
      map: {},
      coordinates: [
        { x: "106.918082", y: "31.441314" }, //重庆
        { x: "86.36158200334317", y: "41.42448570787448" }, //新疆
        { x: "89.71757707811526", y: "31.02619817424643" }, //西藏
        { x: "116.31694544853109", y: "39.868508850821115" }, //北京
        { x: "103.07940932026341", y: "30.438580338450862" }, //成都
      ],
      speed: 0.3,
    };
  },
  mounted() {
    this.initMap();
    this.addDynamicPoints(this.coordinates);
  },
  methods: {
    /**
     * 初始化地图
     */
    initMap() {
      this.map = new Map({
        target: "map",
        layers: [
          new TileLayer({
            source: new XYZ({
              url: "http://map.geoq.cn/ArcGIS/rest/services/ChinaOnlineStreetPurplishBlue/MapServer/tile/{z}/{y}/{x}",
            }),
          }),
        ],
        view: new View({
          projection: "EPSG:4326",
          center: [108.522097, 37.272848],
          zoom: 4.7,
        }),
      });
    },
    /**
     * 批量添加闪烁点
     */
    addDynamicPoints(coordinates) {
      // 设置图层
      let pointLayer = new VectorLayer({ source: new VectorSource() });
      // 添加图层
      this.map.addLayer(pointLayer);
      // 循环添加feature
      let pointFeature = [];
      for (let i = 0; i < coordinates.length; i++) {
        // 创建feature,一个feature就是一个点坐标信息
        const feature = new Feature({
          geometry: new Point([coordinates[i].x, coordinates[i].y]),
        });
        pointFeature.push(feature);
      }
      //把要素集合添加到图层
      pointLayer.getSource().addFeatures(pointFeature);
      // 关键的地方在此:监听postrender事件,在里面重新设置circle的样式
      let radius = 0;
      pointLayer.on("postrender", (e) => {
        if (radius >= 20) radius = 0;
        let opacity = (20 - radius) * (1 / 20); //不透明度
        let pointStyle = new Style({
          image: new Circle({
            radius: radius,
            stroke: new Stroke({
              color: "rgba(255,0,0" + opacity + ")",
              width: 3 - radius / 10, //设置宽度
            }),
          }),
        });
        // 获取矢量要素上下文
        let vectorContext = getVectorContext(e);
        vectorContext.setStyle(pointStyle);
        pointFeature.forEach((feature) => {
          vectorContext.drawGeometry(feature.getGeometry());
        });
        radius = radius + this.speed; //调整闪烁速度
        //请求地图渲染(在下一个动画帧处)
        this.map.render();
      });
    },
  },
};
</script>

参考:https://xiehao.blog.csdn.net/article/details/119955823

到此这篇关于Vue+Openlayer批量设置闪烁点的实现代码(基于postrender机制)的文章就介绍到这了,更多相关Vue Openlayer闪烁点内容请搜索我们以前的文章或继续浏览下面的相关文章希望大家以后多多支持我们!

(0)

相关推荐

  • vue-openlayers实现地图坐标弹框效果

    本文实例为大家分享了vue-openlayers实现地图坐标弹框的具体代码,供大家参考,具体内容如下 openlayers 这个效果是点击地图,弹出坐标信息. 点击地图边缘时,底图会跟着移动,使弹窗能完整显示出来. <template> <div class="vm"> <h2 class="h-title">弹窗 popup</h2> <div id="map" class="ma

  • vue集成openlayers加载geojson并实现点击弹窗教程

    本文实例为大家分享了vue+openlayers加载geojson并实现点击弹窗教程,供大家参考,具体内容如下 第一步:安装vue-cli cnpm install -g @vue/cli 第二步:新建一个项目 1.新建项目 (vue-openlayers为项目名),并选择default模版 vue create vue-openlayers 2.安装openlayers cnpm i -S ol 第三步:写业务代码 1.删除掉HelloWorld.vue 新建 olmap.vue组件 comp

  • 基于Vue+Openlayer实现动态加载geojson的方法

    加载1个或多个要素 <template> <div id="map" style="width: 100vw; height: 100vh"></div> </template> <script> import "ol/ol.css"; import TileLayer from "ol/layer/Tile"; import VectorLayer from &qu

  • vue项目中openlayers绘制行政区划

    vue项目中openlayers画行政区划(区域范围),供大家参考,具体内容如下 原理 在地图上画需要的范围,实际上就是在地图上打上一圈点,然后依次将这些点用线连接,就形成了范围 引用相应的ol模块 import VectorLayer from 'ol/layer/Vector' import VectorSource from 'ol/source/Vector' import { Map, View, Feature } from 'ol' import { Style, Icon, St

  • Vue+Openlayers自定义轨迹动画

    本文实例为大家分享了Vue+Openlayers实现轨迹动画的具体代码,供大家参考,具体内容如下 <template> <div class="map-warp"> <h3> <a href="https://openlayers.org/en/latest/examples/feature-move-animation.html?q=polyline" target="_bank" >Openla

  • VUE + OPENLAYERS实现实时定位功能

    前言 本系列文章介绍一个简单的实时定位示例,示例的组成主要包括: 服务后端,使用 Java 语言编写,模拟生成 GeoJSON 数据. 前端展示,使用 Vue + OpenLayers ,负责定时向后端服务请求 GeoJSON 数据,并在以标签的形式展现定位数据. 实现的效果: 一.定义标签样式 var image = new CircleStyle({ radius: 5, fill: new Fill({ color: "rgba(255, 0, 0, 1)" }), stroke

  • Vue中使用Openlayer实现加载动画效果

    注意:实现动画时不能有scoped!!!!  通过gif <template> <div class="test"> <div id="map" ref="map" style="width: 100vw; height: 100vh"></div> </div> </template> <script> import "ol/ol.

  • vue+openlayers绘制省市边界线

    本文实例为大家分享了vue+openlayers绘制省市边界线的具体代码,供大家参考,具体内容如下 1.创建项目 vue init webpack ol_vue 2.安装ol依赖包 npm install ol 3.引入axios npm install axios --save 文件目录:src/main.js import Vue from 'vue' import router from './router' import App from './App' import axios fro

  • Vue+Openlayer批量设置闪烁点的实现代码(基于postrender机制)

    效果图: 实现代码: <template> <div id="map" style="width: 100vw; height: 100vh" /> </template> <script> import "ol/ol.css"; import TileLayer from "ol/layer/Tile"; import VectorLayer from "ol/lay

  • 通过命令行方式批量设置保留IP地址的代码

    前段时间看到一个提问关于如何批量设置DHCP保留地址的贴子,后来经作实验测试,现将解决方法分享给大家,供互相学习讨论. 首先我们知道DHCP添加保留地址的方法有两种.一种在作用域的保留地址添加:另一种方法通过命令行批量添加. 下面介绍的是如何通过命令行添加保留地址的方法:(此方法在2003R2及2008R2上测试可用) 复制代码 代码如下: dhcp server 172.16.2.10 scope 172.16.2.0 add reservedip172.16.2.100 00055de2e5

  • Vue+Openlayer使用modify修改要素的完整代码

    Vue+Openlayer使用modify修改要素,具体内容如下所示: import { Modify } from "ol/interaction"; 可自动捕捉 可修改点.线.面.不用自己声明要修改的要素类型 直接修改要素 核心代码: // 修改要素核心代码 modifyFeature() { this.modify = new Modify({ source: this.lineStringLayer.getSource(), }); this.map.addInteractio

  • Vue+Openlayer中使用select选择要素的实现代码

    效果图: 实现代码: <template> <div id="map" ref="map" style="width: 100vw; height: 100vh"></div> </template> <script> import "ol/ol.css"; import { Map, View } from "ol"; import { OSM,

  • 基于vue+openlayer实现地图聚合和撒点效果

    目录 前言: 实现效果: 1.聚合效果: 2.撒点效果: 具体实现步骤: 1.项目中引入openlayer 2.配置(按需引入) 3.实现地图展示 4.撒点功能 5.聚合效果 前言: openlayer是目前我们gis常用的一款开源的,并且反馈都特别好的软件了,像之前的ol3, 风靡一时,地图实现也很简单,很实用,目前vue中使用地图也是非常多的,那么如果在vue中引入openlayer并且实现地图撒点效果,甚至是更深层的地图聚合效果呢,本文来分享下vue中地图的实现.目前openlayer的

  • Vue+Openlayer实现图形的拖动和旋转变形效果

    目录 前言 相关资料 实现效果  实现步骤 前言 openlayer 是有他自己的扩展插件 ol-ext,我们这里用他来实现图形的操作:拖拽.旋转.缩放.拉伸.移动等等功能,以及他的监听事件,毕竟我们作图以后是需要保存数据给后端,存到数据库的. 相关资料 1.ol-ext官方地址:入口 2.ol-ext 对应的资料地址:入口 3.ol-ext 源码gitee地址:入口 4.openlayers 最新官网:入口 5.openlayers 官网api:入口 实现效果 旋转.拖动 图1.实现效果 图2

  • Vue+OpenLayer实现测距功能

    目录 前言 引入相关库文件 绘制提示文字 鼠标绘制线 设置距离信息窗 绘制完成 取消绘制 全部代码 前言 首先呢说明一下,我是跟着一个大佬学的,所以我是个小次佬,openlayer的官网上面给出了案例,但是习惯vue开发的我完全不理解,关键是连注释都没多少,而且我 openlayer 用的本来就不多. 然后这里分享一下官网的测距案例 引入相关库文件 这个库文件直接按照官网的来就可以了. 首先说一个事情哈,官网用的案例是地图使用的 EPSG:3857, 如果我们改成 EPSG:4326,测量数据不

  • js批量设置样式的三种方法不推荐使用with

    一般我们都用css来批量设置样式,现在我们用js也可以批量设置样式: 总结三种方法如下 复制代码 代码如下: <html> <head> <meta http-equiv="Content-Type" content="text/html; charset=utf-8"> <title>无标题文档</title> <style type="text/css"> #div1{

  • 利用vue和element-ui设置表格内容分页的实例

    html代码 因为我写在template中,也就是新建了组建中,贴出代码. <el-pagination small layout="prev, pager, next" :total="total" @current-change="current_change"> </el-pagination> 代码中,small代表是否使用小型分页样式 layout代表组件布局,子组件名用逗号分隔 属性: total代表总条目数

随机推荐