vue中使用词云图的实现示例
在vue中, 查找到有两种方法来实现词云图, 分别是echarts 和 highcharts
Echarts:
注意,wordcloud对应的echarts版本有要求:echarts-wordcloud@2 is for echarts@5 echarts-wordcloud@1 is for echarts@4
需要下载echartsjs 和 wordcloud, 全局注册引用echarts
	npm install echarts@5
	npm install echarts-wordcloud@2
<div class="cloud-wrap">
    <div ref="cloudEl" class="cloud-box"></div>
</div>
<style>
.cloud-wrap {
    width: 100%;
    height: 100%;
}
 .cloud-box {
     width: 100%;
     height: 100%;
 }
</style>
<script>
import wordcloud from 'echarts-wordcloud';
export default {
	data() {
		return {
			words:[{
				id:1,
				content:'name'
			}],
			bgImg:'base64格式, 底色为白色',
		}
	},
	mounted() {
      this.drawCloud(this.$refs.cloudEl, this.words);
  	},
  	methods:{
	  	drawCloud(wrapEl, data) {
	        // let maskImage = new Image(); //可以根据图片形状生成有形状的词云图
	        // maskImage.src= this.bgImg;
	        let list = this.wordCloudData.map((item) => ({
	            name: item.content,
	            value: item.id
	        }))
	        if(list.length == 0){
	            list = [{name:'无',value:50}]
	        }
	        let myChart = echarts.init(wrapEl);
	        let option =
	        {
	            tooltip: {
	                show: true,
	            },
	            // backgroundColor:'#fff', // 画布背景色
	            series: [
	            {
	                name: "热词",
	                type: "wordCloud",
	                // maskImage: maskImage, // 图片形状
	                keepAspect: false,
	                sizeRange: [10, 40], //画布范围,如果设置太大会出现少词(溢出屏幕)
	                rotationRange: [0, 0], //数据翻转范围
	                // shape: "circle",
	                // drawOutOfBound: true, // 超出画布的词汇是否隐藏
	                drawOutOfBound: false,
	                color:"#fff",
	                left: "center",
	                top: "center",
	                right: null,
	                bottom: null,
	                // width: "100%",
	                height: "100%",
	                gridSize: 8,
	                textPadding: 10,
	                autoSize: {
	                    enable: true,
	                    minSize: 6,
	                },
	                textStyle: {
	                    normal: {
	                        fontFamily: 'sans-serif',
	                        fontWeight: 'bold',
	                        color:"#333", // 字体颜色
	                        // color: function () { // 字体颜色
	                        //     return 'rgb(' + [
	                        //         Math.round(Math.random() * 160),
	                        //         Math.round(Math.random() * 160),
	                        //         Math.round(Math.random() * 160)
	                        //     ].join(',') + ')';
	                        // },
	                    },
	                    emphasis: {
	                        // focus: 'self',
	                        textStyle:{
	                            shadowBlur: 10,
	                            shadowColor: "#333",
	                        }
	                    },
	                },
	                data: list,
	            },
	            ],
	        };
	        // maskImage.onload = function() {
	            myChart.setOption(option, true)
	        // };
	    },
  	}
}
</script>

无遮罩层的词云图↑
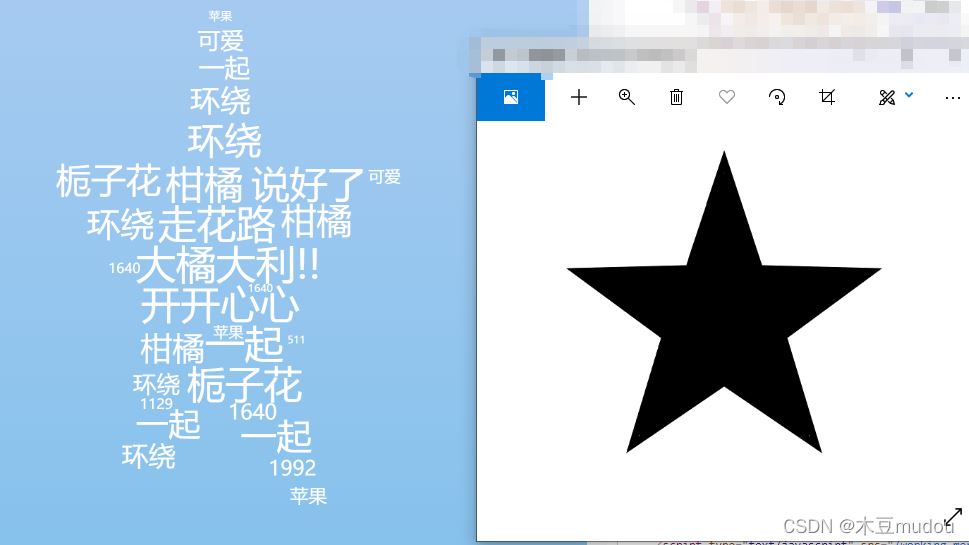
有遮罩层的词云图↑
Highcharts
下载包
npm install highcharts@7.2.1
<div class="cloud-wrap">
    <div id="container" style="width: 100%;height: 100%;"></div>
</div>
<style>
	// 同上
</style>
<script>
import Highcharts from 'highcharts'
export default {
	data() {
		return {
			words:[{
				id:1,
				content:'name'
			}],
		}
	},
	mounted() {
      this.dealData();
  	},
  	methods:{
	    dealData(){
	        let data = this.words.map((item,index) => ({
	            name: item.content,
	            value: item.id,
	            //weight: Math.floor(Math.random()*3+1)
	            //控制加粗,随机数取1~3, 若需要按照接口返回的顺序, 可不随机
	            weight: item.id*100
	        }))
	        this.drawPic(data)
	    },
	    drawPic(data){
	        Highcharts.chart('container', {
	            //highcharts logo
	            credits: { enabled: false },
	            //导出
	            exporting: { enabled: false },
	            //提示关闭
	            tooltip: { enabled: false },
	            //颜色配置
	            colors:[
	                '#ffffff'
	                // ,'#00c0d7','#2594ce','#de4c85',
	                // '#ff7f46','#ffb310','#e25c52'
	            ],
	            //图形配置
	            chart: {
	                // spacingBottom: 15,
	                // spacingTop: 12,
	                spacingLeft: 5,
	                spacingRight: 5,
	                backgroundColor: "rgba(255, 255, 255,0)",
	            },

	            series: [{
	                type: "wordcloud",// 类型
	                data: data,
	                rotation: 90,//字体不旋转
	                maxFontSize: 40,//最大字体
	                minFontSize: 14,//最小字体
	                style: {
	                    fontFamily: "sans-serif",
	                    fontWeight: '500'
	                }
	            }],
	        });
	    },
  	}
}
</script>

echarts 和 highcharts 都可以在vue中实现词云图. 但是如果使用echarts的话, 需要当前的echarts进行升级或降级才能实现字体多颜色, 而highcharts则不需要. 自定义形状highcharts暂时还没探究, 需要的可以自行查找, 以后有机会的话我也会看看.
到此这篇关于vue中使用词云图的文章就介绍到这了,更多相关vue中使用词云图内容请搜索我们以前的文章或继续浏览下面的相关文章希望大家以后多多支持我们!
相关推荐
-

vue使用echarts词云图的实战记录
echarts词云图是echarts的一个扩展 https://echarts.apache.org/zh/download-extension.html 1.安装依赖 npm install echarts npm install echarts-wordcloud 2.main.js引入 import echarts from 'echarts'; Vue.prototype.$echarts = echarts 3.在用到的组件中引入扩展 <script> import "
-
vue中使用词云图的实现示例
在vue中, 查找到有两种方法来实现词云图, 分别是echarts 和 highcharts Echarts: 注意,wordcloud对应的echarts版本有要求:echarts-wordcloud@2 is for echarts@5 echarts-wordcloud@1 is for echarts@4 需要下载echartsjs 和 wordcloud, 全局注册引用echarts npm install echarts@5 npm install echarts-wordcloud
-
python中实现词云图的示例
import matplotlib.pyplot as plt import jieba from wordcloud import wordcloud # 1.读出词语 text = open('text/test.txt', 'r', encoding='utf-8').read() print(text) # 2.把歌词剪开 cut_text = jieba.cut(text) # print(type(cut_text)) # print(next(cut_text)) # print(
-
在vue中使用Echarts画曲线图的示例
现实的工作中, 数据不可能写死的,所有的数据都应该通过发送请求进行获取. 所以本项目的需求是请求服务器获得二维数组,并生成曲线图.曲线图的横纵坐标均从获得的数据中取得. Echarts官方文档: https://ecomfe.github.io/echarts-doc/public/en/index.html 前端框架使用vue,服务器使用express搭建,交互使用axios. 一.引入vue-resource 通过npm下载vue-resource npm install vue-resou
-
vue中template的三种写法示例
第一种(字符串模板写法): 直接写在vue构造器里,这种写法比较直观,适用于html代码不多的场景,但是如果模板里html代码太多,不便于维护,不建议这么写. <!DOCTYPE html> <html> <!-- WARNING! Make sure that you match all Quasar related tags to the same version! (Below it's "@1.7.4") --> <head> &
-
vue中对接Graphql接口的实现示例
说明: 本文是本人正在搞nestjs+graphql+serverless训练营中对Graphql讲解的基础知识点,可能有点前后没对接上,文中提到的Graphql授权也是下小节介绍的 一.对原来的Express返回Graphql项目修改 本章节使用的代码是express返回Graphql的代码,在使用前要先对代码进行基本的配置,比如处理跨域问题(Graphql本质也是发送一个http请求,既然是这样在vue项目中自然存在跨域的问题,需要先处理) 1.安装跨域的包,并且配置中间件 npm inst
-
vue中的使用token的方法示例
初始于登录页面 Home.vue <template> <div class="home"> </div> </template> <script> // @ is an alias to /src import HelloWorld from '@/components/HelloWorld.vue' import axios from 'axios'; export default { name: 'home', comp
-
vue中使用element日历组件的示例代码
先看下效果图: 完整代码附上 <template> <div class="newSeeds" id="famerCalendar"> <div class="title-bottom"> <el-date-picker :clearable="false" prefix-icon="timeFilter" v-model="value2" ty
-
vue中rem的配置的方法示例
在用vue或react等工具搭建一个移动端项目时,怎样做到自适应呢? 当然选择rem布局比较方便快捷. 开发移动端,我们常常要用到rem+flex,那么vue中如何配置呢,我的做法是这样: 1.在js中统一计算配置 代码如下: export default function() { // var devicePixelRatio = 1; // var scale = 1 / devicePixelRatio; // document.querySelector('meta[name="view
-
vue中动态select的使用方法示例
本文实例讲述了vue中动态select的使用方法.分享给大家供大家参考,具体如下: html代码如下: 通过v-model可以获取到选中的值,如果没值就默认第一个;如果有值就显示有值的那个内容 <template> <div class="violationsList"> <div class="type-select"> <select name="selected" id="" v