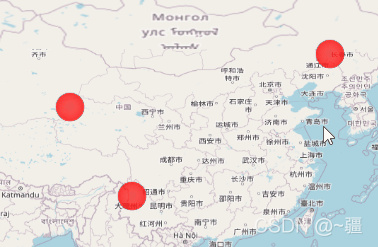
Vue中使用Openlayer实现加载动画效果
注意:实现动画时不能有scoped!!!!
通过gif

<template>
  <div class="test">
    <div id="map" ref="map" style="width: 100vw; height: 100vh"></div>
  </div>
</template>

<script>
import "ol/ol.css";
import { Map, View, Overlay } from "ol";
import TileLayer from "ol/layer/Tile";
import OSM from "ol/source/OSM";

export default {
  name: "gif",
  data() {
    return {
      map: {},
      overlay: {},
      markerPoint: {},
      geojsonData: {
        type: "FeatureCollection",
        features: [
          {
            type: "Feature",
            properties: {
              title: "警报1",
            },
            geometry: {
              type: "Point",
              coordinates: [91.48879670091165, 37.83814884701121],
            },
          },
          {
            type: "Feature",
            properties: {
              title: "警报2",
            },
            geometry: {
              type: "Point",
              coordinates: [99.19515576149941, 26.713646654711134],
            },
          },
          {
            type: "Feature",
            properties: {
              title: "警报3",
            },
            geometry: {
              type: "Point",
              coordinates: [123.74363825288785, 44.363694825734726],
            },
          },
        ],
      },
    };
  },
  mounted() {
    this.initMap();
    this.addGif();
  },
  methods: {
    // 初始化地图
    initMap() {
      this.map = new Map({
        target: "map",
        layers: [
          new TileLayer({
            source: new OSM(),
          }),
        ],
        view: new View({
          projection: "EPSG:4326",
          center: [104.912777, 34.730746],
          zoom: 4.5,
        }),
      });
    },
    // 使用Overlay添加GIF动态图标点位信息
    addGif() {
      let coordinates = this.getCoordinatesByGeojson(this.geojsonData);

      for (const i in coordinates) {
        let gif_span = document.createElement("span");

        document.documentElement.appendChild(gif_span);
        this.$nextTick(() => {
          this.markerPoint = new Overlay({
            position: coordinates[i],
            element: gif_span,
            positioning: "center-center",
          });
          this.map.addOverlay(this.markerPoint);
        });
      }
    },
    //根据geojson数据获取坐标集
    getCoordinatesByGeojson(geojsonData) {
      let coordinates = [];
      geojsonData.features.map((feature) => {
        coordinates = [...coordinates, feature.geometry.coordinates];
      });
      return coordinates;
    },
  },
};
</script>
<style lang='scss' >
.test {
  span {
    display: inline-block;
    width: 80px;
    height: 80px;
    border-radius: 50%;
    background: url("https://smart-garden-manage.oss-cn-chengdu.aliyuncs.com/gif.gif")
      no-repeat;
    background-size: 80px 80px;
  }
}
</style>
通过关键帧@keyframes

<template>
  <div class="test">
    <div id="map" ref="map" style="width: 100vw; height: 100vh"></div>
  </div>
</template>

<script>
import "ol/ol.css";
import { Map, View, Overlay } from "ol";
import TileLayer from "ol/layer/Tile";
import OSM from "ol/source/OSM";

export default {
  name: "gif",
  data() {
    return {
      map: {},
      overlay: {},
      point_overlay: {},
      geojsonData: {
        type: "FeatureCollection",
        features: [
          {
            type: "Feature",
            properties: {
              title: "警报1",
            },
            geometry: {
              type: "Point",
              coordinates: [91.48879670091165, 37.83814884701121],
            },
          },
          {
            type: "Feature",
            properties: {
              title: "警报2",
            },
            geometry: {
              type: "Point",
              coordinates: [99.19515576149941, 26.713646654711134],
            },
          },
          {
            type: "Feature",
            properties: {
              title: "警报3",
            },
            geometry: {
              type: "Point",
              coordinates: [123.74363825288785, 44.363694825734726],
            },
          },
        ],
      },
    };
  },
  mounted() {
    this.initMap();
    this.addGif();
  },
  methods: {
    // 初始化地图
    initMap() {
      this.map = new Map({
        target: "map",
        layers: [
          new TileLayer({
            source: new OSM(),
          }),
        ],
        view: new View({
          projection: "EPSG:4326",
          center: [104.912777, 34.730746],
          zoom: 4.5,
        }),
      });
    },
    // 使用Overlay添加GIF动态图标点位信息
    addGif() {
      let coordinates = this.getCoordinatesByGeojson(this.geojsonData);

      for (const i in coordinates) {
        let point_div = document.createElement("div");
        point_div.className = "css_animation";
        point_div.id = `coordinate_${i}`;
        document.documentElement.appendChild(point_div);

        this.$nextTick(() => {
          this.point_overlay = new Overlay({
            position: coordinates[i],
            element: point_div,
            positioning: "center-center",
          });
          this.map.addOverlay(this.point_overlay);
        });
      }
    },
    //根据geojson数据获取坐标集
    getCoordinatesByGeojson(geojsonData) {
      let coordinates = [];
      geojsonData.features.map((feature) => {
        coordinates = [...coordinates, feature.geometry.coordinates];
      });
      return coordinates;
    },
  },
};
</script>
<style lang='scss' >
.test {
  .css_animation {
    height: 50px;
    width: 50px;
    border-radius: 50%;
    background: rgba(255, 0, 0, 0.9);
    box-shadow: inset 0 0 8px red;
    transform: scale(0);
    animation: myfirst 3s;
    animation-iteration-count: infinite; //无限循环
  }
  @keyframes myfirst {
    to {
      transform: scale(2);
      background: rgba(0, 0, 0, 0);
      box-shadow: inset 0 0 50px rgba(255, 0, 0, 0);
    }
  }
}
</style>
既可加载动画,又可获取动画所在要素点的属性


注意:该代码存在问题。目前只能要么点击获取属性,要么展示动画,而不能同时存在,还有待优化!
<template>
  <div class="test">
    <div id="map" ref="map" style="width: 100vw; height: 100vh"></div>
    <div
      id="popup"
      style="
        position: absolute;
        background-color: rgba(47, 57, 90, 0.678);
        bottom: 20px;
        left: 30px;
        border: 1px solid white;
        padding: 10px;
        width: 60px;
      "
    >
      {{ properties.title }}
    </div>
  </div>
</template>

<script>
import "ol/ol.css";
import { Map, View, Overlay } from "ol";
import { OSM, Vector as VectorSource } from "ol/source";
import { Vector as VectorLayer, Tile as TileLayer } from "ol/layer";
import GeoJSON from "ol/format/GeoJSON";

import Select from "ol/interaction/Select";
import { altKeyOnly, click, pointerMove } from "ol/events/condition";
import { Fill, Stroke, Style, Circle } from "ol/style";

export default {
  name: "gif",
  data() {
    return {
      map: {},
      layer: {},

      overlay: {},
      point_overlay: {},
      geojsonData: {
        type: "FeatureCollection",
        features: [
          {
            type: "Feature",
            properties: {
              title: "警报1",
            },
            geometry: {
              type: "Point",
              coordinates: [91.48879670091165, 37.83814884701121],
            },
          },
          {
            type: "Feature",
            properties: {
              title: "警报2",
            },
            geometry: {
              type: "Point",
              coordinates: [99.19515576149941, 26.713646654711134],
            },
          },
          {
            type: "Feature",
            properties: {
              title: "警报3",
            },
            geometry: {
              type: "Point",
              coordinates: [123.74363825288785, 44.363694825734726],
            },
          },
        ],
      },

      select: {},
      properties: {
        title: "",
      },
    };
  },
  mounted() {
    this.initMap();
    // this.addGif();//注释掉后,点击可获取feature属性
  },
  methods: {
    // 初始化地图
    initMap() {
      this.layer = new VectorLayer({
        source: new VectorSource({
          features: new GeoJSON().readFeatures(this.geojsonData),
        }),
      });
      this.map = new Map({
        target: "map",
        layers: [
          new TileLayer({
            source: new OSM(),
          }),
          this.layer,
        ],
        view: new View({
          projection: "EPSG:4326",
          center: [104.912777, 34.730746],
          zoom: 4.5,
        }),
      });

      this.select = new Select({
        condition: click, //单击选择
      });
      this.map.addInteraction(this.select);

      let overlayer_popup = new Overlay({
        element: document.getElementById("popup"),
        positioning: "center-center", //一定要加上,否则会有偏移
      });

      this.select.on("select", (e) => {
        let coordinate = e.mapBrowserEvent.coordinate; //获取选择的坐标

        let featureSelect = e.selected[0]; //选中的feature要素

        if (e.selected.length !== 0) {
          overlayer_popup.setPosition(coordinate);
          this.map.addOverlay(overlayer_popup);
        } else {
          overlayer_popup.setPosition("");
        }

        if (featureSelect) {
          this.properties = featureSelect.getProperties(); //获取当前要素的所有属性
          //设置选中的样式
          featureSelect.setStyle(
            new Style({
              image: new Circle({
                radius: 10,
                fill: new Fill({
                  //矢量图层填充颜色,以及透明度
                  color: "rgba(255,0,0,0.5)",
                }),
                stroke: new Stroke({
                  //边界样式
                  color: "rgba(100, 90, 209, 0.6)",
                  width: 3,
                }),
              }),
            })
          );
        }
      });

      // 设置鼠标划过矢量要素的样式
      this.map.on("pointermove", (e) => {
        const isHover = this.map.hasFeatureAtPixel(e.pixel);
        this.map.getTargetElement().style.cursor = isHover ? "pointer" : "";
      });
    },
    // 使用Overlay添加GIF动态图标点位信息
    addGif() {
      let coordinates = this.getCoordinatesByGeojson(this.geojsonData);

      for (const i in coordinates) {
        let point_div = document.createElement("div");
        point_div.className = "css_animation";
        point_div.id = `coordinate_${i}`;
        document.documentElement.appendChild(point_div);

        this.$nextTick(() => {
          this.point_overlay = new Overlay({
            position: coordinates[i],
            element: point_div,
            positioning: "center-center",
          });
          this.map.addOverlay(this.point_overlay);
        });
      }
    },
    //根据geojson数据获取坐标集
    getCoordinatesByGeojson(geojsonData) {
      let coordinates = [];
      geojsonData.features.map((feature) => {
        coordinates = [...coordinates, feature.geometry.coordinates];
      });
      return coordinates;
    },
  },
};
</script>
<style lang='scss' scoped>
.test {
}
</style>
<style lang='scss' >
.test {
  .css_animation {
    height: 50px;
    width: 50px;
    border-radius: 50%;
    background: rgba(255, 0, 0, 0.9);
    box-shadow: inset 0 0 8px red;
    transform: scale(0);
    animation: myfirst 3s;
    animation-iteration-count: infinite; //无限循环
  }
  @keyframes myfirst {
    to {
      transform: scale(2);
      background: rgba(0, 0, 0, 0);
      box-shadow: inset 0 0 50px rgba(255, 0, 0, 0);
    }
  }
}
</style>
到此这篇关于Vue+Openlayer加载动画的文章就介绍到这了,更多相关Vue Openlayer加载动画内容请搜索我们以前的文章或继续浏览下面的相关文章希望大家以后多多支持我们!
赞 (0)

