Python利用networkx画图绘制Les Misérables人物关系
目录
- 数据集介绍
- 数据处理
- 画图
- networkx自带的数据集
- 完整代码
数据集介绍
《悲惨世界》中的人物关系图,图中共77个节点、254条边。
数据集截图:
打开README文件:
Les Misérables network, part of the Koblenz Network Collection
===========================================================================
This directory contains the TSV and related files of the moreno_lesmis network: This undirected network contains co-occurances of characters in Victor Hugo's novel 'Les Misérables'. A node represents a character and an edge between two nodes shows that these two characters appeared in the same chapter of the the book. The weight of each link indicates how often such a co-appearance occured.
More information about the network is provided here:
http://konect.cc/networks/moreno_lesmis
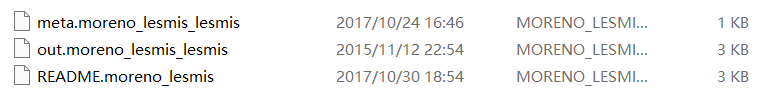
Files:
meta.moreno_lesmis -- Metadata about the network
out.moreno_lesmis -- The adjacency matrix of the network in whitespace-separated values format, with one edge per line
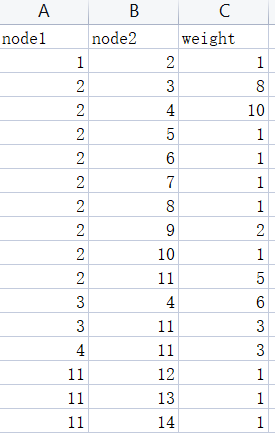
The meaning of the columns in out.moreno_lesmis are:
First column: ID of from node
Second column: ID of to node
Third column (if present): weight or multiplicity of edge
Fourth column (if present): timestamp of edges Unix time
Third column: edge weight
Use the following References for citation:
@MISC{konect:2017:moreno_lesmis,
title = {Les Misérables network dataset -- {KONECT}},
month = oct,
year = {2017},
url = {http://konect.cc/networks/moreno_lesmis}
}
@book{konect:knuth1993,
title = {The {Stanford} {GraphBase}: A Platform for Combinatorial Computing},
author = {Knuth, Donald Ervin},
volume = {37},
year = {1993},
publisher = {Addison-Wesley Reading},
}
@book{konect:knuth1993,
title = {The {Stanford} {GraphBase}: A Platform for Combinatorial Computing},
author = {Knuth, Donald Ervin},
volume = {37},
year = {1993},
publisher = {Addison-Wesley Reading},
}
@inproceedings{konect,
title = {{KONECT} -- {The} {Koblenz} {Network} {Collection}},
author = {Jérôme Kunegis},
year = {2013},
booktitle = {Proc. Int. Conf. on World Wide Web Companion},
pages = {1343--1350},
url = {http://dl.acm.org/citation.cfm?id=2488173},
url_presentation = {https://www.slideshare.net/kunegis/presentationwow},
url_web = {http://konect.cc/},
url_citations = {https://scholar.google.com/scholar?cites=7174338004474749050},
}
从中可以得知:该图是一个无向图,节点表示《悲惨世界》中的人物,两个节点之间的边表示这两个人物出现在书的同一章,边的权重表示两个人物(节点)出现在同一章中的频率。
真正的数据在out.moreno_lesmis_lesmis中,打开并另存为csv文件:
数据处理
networkx中对无向图的初始化代码为:
g = nx.Graph()
g.add_nodes_from([i for i in range(1, 78)])
g.add_edges_from([(1, 2, {'weight': 1})])
节点的初始化很容易解决,我们主要解决边的初始化:先将dataframe转为列表,然后将其中每个元素转为元组。
df = pd.read_csv('out.csv')
res = df.values.tolist()
for i in range(len(res)):
    res[i][2] = dict({'weight': res[i][2]})
res = [tuple(x) for x in res]
print(res)
res输出如下(部分):
[(1, 2, {'weight': 1}), (2, 3, {'weight': 8}), (2, 4, {'weight': 10}), (2, 5, {'weight': 1}), (2, 6, {'weight': 1}), (2, 7, {'weight': 1}), (2, 8, {'weight': 1})...]
因此图的初始化代码为:
g = nx.Graph()
g.add_nodes_from([i for i in range(1, 78)])
g.add_edges_from(res)
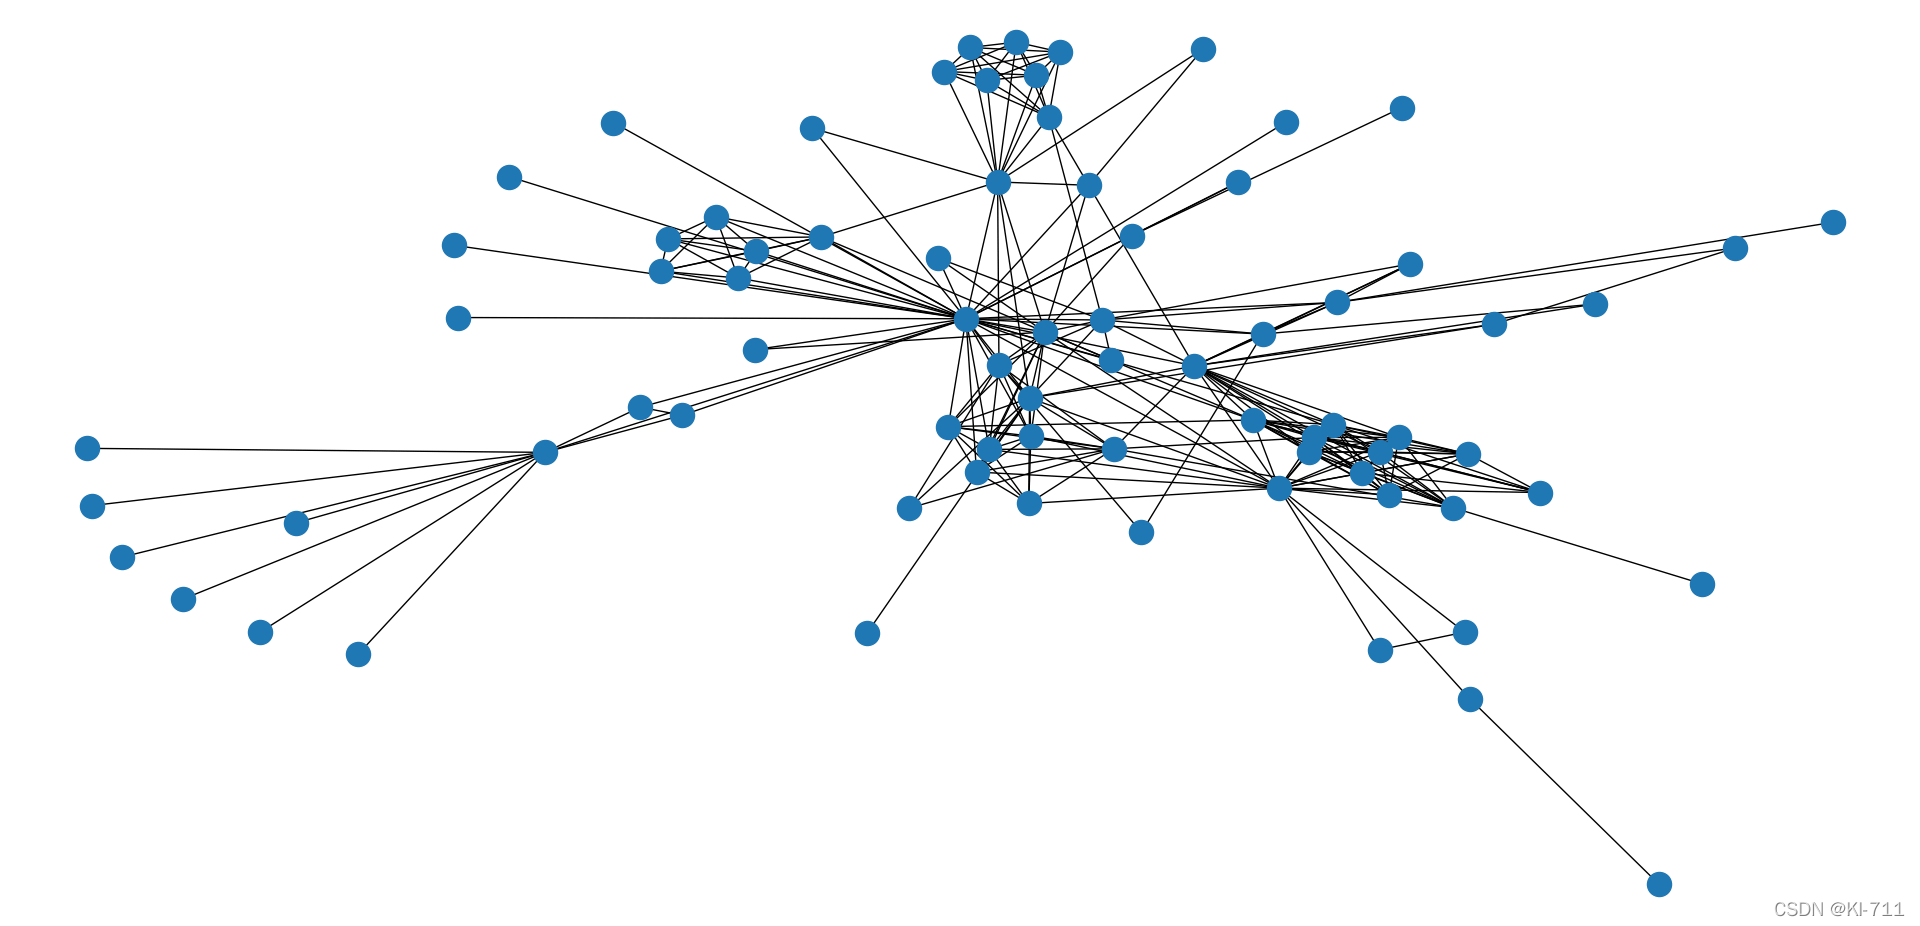
画图
nx.draw(g)
plt.show()
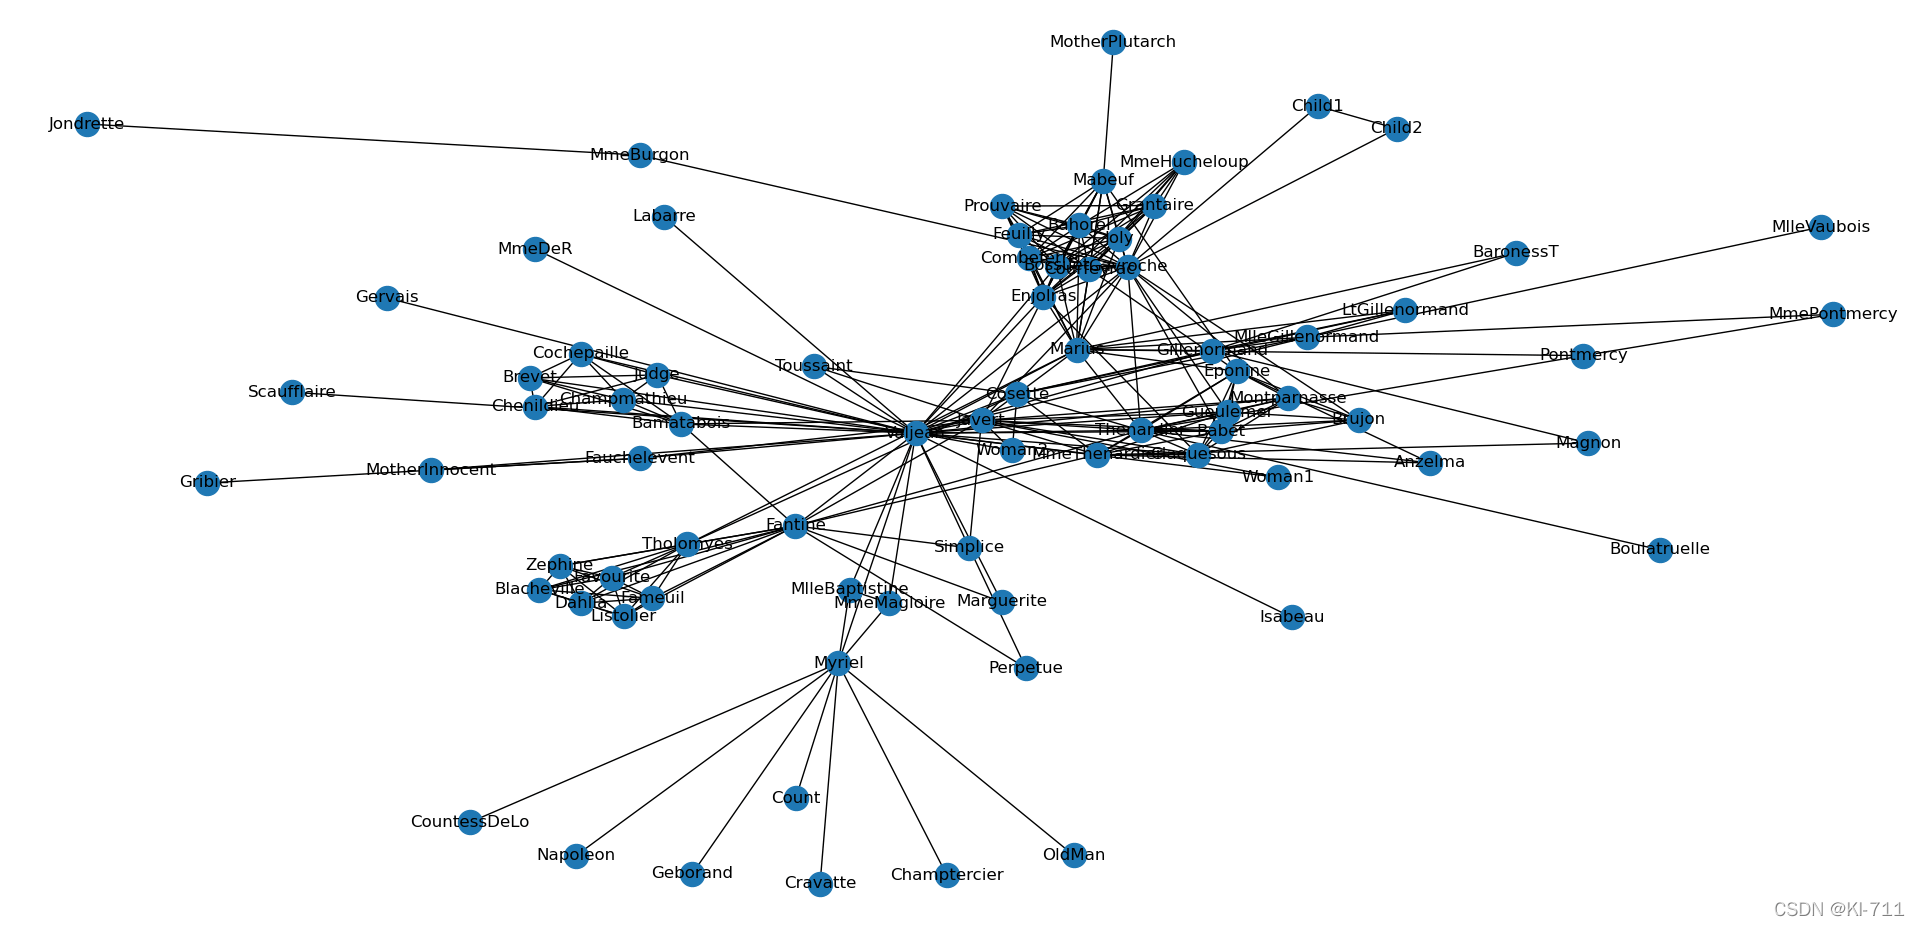
networkx自带的数据集
忙活了半天发现networkx有自带的数据集,其中就有悲惨世界的人物关系图:
g = nx.les_miserables_graph()
nx.draw(g, with_labels=True)
plt.show()
完整代码
# -*- coding: utf-8 -*-
import networkx as nx
import matplotlib.pyplot as plt
import pandas as pd
# 77 254
df = pd.read_csv('out.csv')
res = df.values.tolist()
for i in range(len(res)):
    res[i][2] = dict({'weight': res[i][2]})
res = [tuple(x) for x in res]
print(res)
# 初始化图
g = nx.Graph()
g.add_nodes_from([i for i in range(1, 78)])
g.add_edges_from(res)
g = nx.les_miserables_graph()
nx.draw(g, with_labels=True)
plt.show()
以上就是Python利用networkx画图绘制Les Misérables人物关系的详细内容,更多关于Python networkx画图绘制的资料请关注我们其它相关文章!
相关推荐
-
Python Matplotlib 基于networkx画关系网络图
前言 昨天才开始接触,鼓捣了一个下午,接下来会持续更新,如果哪里有错误的地方,望各位大佬指出,谢谢! 数据描述 两个文件,一个文件包含了网络图的节点,节点存在类别(0,1,2,3)四类,但是0类别舍去,不画出:另一个文件包含了网络图的边,数据基本特征如下: 图1中,id表示节点,b是类别:图2中,两个数字表示边连接的两个点. Networkx 安装 我的系统是Mac OS,直接在terminal输入sudo pip install networkx就可以安装,由于代码
-
python networkx 包绘制复杂网络关系图的实现
1. 创建一个图 import networkx as nx g = nx.Graph() g.clear() #将图上元素清空 所有的构建复杂网络图的操作基本都围绕这个g来执行. 2. 节点 节点的名字可以是任意数据类型的,添加一个节点是 g.add_node(1) g.add_node("a") g.add_node("spam") 添加一组节点,就是提前构建好了一个节点列表,将其一次性加进来,这跟后边加边的操作是具有一致性的. g.add_nodes_from
-
使用Python的networkx绘制精美网络图教程
最近因为数学建模3天速成Python,然后做了一道网络的题,要画网络图.在网上找了一些,发现都是一些很基础的丑陋红点图,并且关于网络的一些算法也没有讲,于是自己进http://networkx.github.io/学习了一下.以下仅博主自己的总结,勿认真,有错误尽情指出,大家一起交流. 需要用到的module malplotlib.pyplot 和networkx 正文: 一.malplotlib和networkx的安装(作者使用的是python2.7 pycharm) 在Python的文件夹目
-
python networkx 根据图的权重画图实现
首先输入边和边的权重,随后画出节点位置,根据权重大小划分实边和虚边 #coding:utf-8 #!/usr/bin/env python """ An example using Graph as a weighted network. """ __author__ = """Aric Hagberg (hagberg@lanl.gov)""" try: import matplotl
-

Python利用networkx画图绘制Les Misérables人物关系
目录 数据集介绍 数据处理 画图 networkx自带的数据集 完整代码 数据集介绍 <悲惨世界>中的人物关系图,图中共77个节点.254条边. 数据集截图: 打开README文件: Les Misérables network, part of the Koblenz Network Collection =========================================================================== This directory con
-
Python利用turtle库绘制彩虹代码示例
语言:Python IDE:Python.IDE 需求 做出彩虹效果 颜色空间 RGB模型:光的三原色,共同决定色相 HSB/HSV模型:H色彩,S深浅,B饱和度,H决定色相 需要将HSB模型转换为RGB模型 代码示例: #-*- coding:utf-8 –*- from turtle import * def HSB2RGB(hues): hues = hues * 3.59 #100转成359范围 rgb=[0.0,0.0,0.0] i = int(hues/60)%6 f = hues/
-
Python利用Turtle库绘制一颗樱花树
后唐李煜曾说道,樱花落尽春将困,秋千架下归时.漏暗斜月迟迟,花在枝.樱花落尽的时候春天也将过去了,秋千架下归去时.天上的斜月姗姗来迟,花还在枝头. 关于python画图相关的,我们一直使用的是turtle来画,用专业的非标准库来做专业的事儿.将需要使用到的内置库或者非标准库全部都导入到当前的代码块中. from time import sleep # 用于控制程序运行时的阻塞停顿 from turtle import * # 绘图相关接口 import random # 生成随机数 设置全局需要
-
python 利用turtle库绘制笑脸和哭脸的例子
我就废话不多说了,直接上代码吧! import turtle turtle.pensize(5) turtle.pencolor("yellow") turtle.fillcolor("red") turtle.penup() turtle.goto(0,-200) turtle.pendown() turtle.circle(200) turtle.penup() turtle.goto(-100,50) turtle.pendown() turtle.begin
-
Python利用Turtle库绘制一个小老虎
目录 导语 1.定义库以及初始化界面 2.画出左右两只耳朵 3.画出小老虎头部轮廓 4. 画出老虎的两只眼睛 5.画出老虎的鼻子和嘴巴 6.画出小老虎的左右肢体和脚趾 7.在需要的位置写上我们的新年祝福 8. 显示倒数3,2,1 9.显示我们需要的文字 10.设定代码运行入口,调用目标函数 成果展示 导语 哈喽铁汁们好久不见吖~小编已经复工了于是马不停蹄赶来给大家准备新年礼物算开工礼物吧! 海龟来作图 虎年就是要画老虎 2022不用纸和笔~ 今晚画老虎~ 一二三四五 老虎宝宝示意图 虎年怎么能少
-
python利用matplotlib库绘制饼图的方法示例
介绍 matplotlib 是python最著名的绘图库,它提供了一整套和matlab相似的命令API,十分适合交互式地进行制图.而且也可以方便地将它作为绘图控件,嵌入GUI应用程序中. 它的文档相当完备,并且 Gallery页面 中有上百幅缩略图,打开之后都有源程序.因此如果你需要绘制某种类型的图,只需要在这个页面中浏览/复制/粘贴一下,基本上都能搞定. matplotlib的安装方法可以点击这里 这篇文章给大家主要介绍了python用matplotlib绘制饼图的方法,话不多说,下面来看代码
-
Python实现七彩蟒蛇绘制实例代码
本文主要研究的是Python编程turtle的实例,绘制一个七彩蟒蛇..具体如下. 第2周的课后练习里,有一道题目,要求修改"蟒蛇绘制"程序,对Python 蟒蛇的每个部分采用不同颜色,绘制一条彩色蟒蛇. 原蟒蛇绘制程序如下: 因为刚开始学Python,不太熟悉,所以自己加了一些注释,方便理解. #蟒蛇绘制 import turtle def drawSnake(rad,angle,len,neckrad): for i in range(len): turtle.circle(rad
-
利用Python的folium包绘制城市道路图的实现示例
写在前面 很长一段时间内,我都在研究在线地图的开发者文档,百度地图和高德地图的开发者中心提供了丰富的在线地图服务,虽然有一定的权限限制,但不得不说,还是给我的科研工作提供了特别方便的工具,在博客前面我先放上这两个在线地图开放平台的web API的地址链接: 百度地图开放平台 高德地图开放平台 基于这两个平台,博主进行了一系列的开发研究工作,本文介绍其中一项技术,如何用folium包绘制城市道路图,当然,也可绘制非城市道路图,只要提供正确的路名就行了. 开发工具: Python3.7 Spyder
-
python绘图模块之利用turtle画图
模块之turtle 小故事 前两天朋友说:"常文啊!听说你会python,那能不能用python画一些好看的图呢?"然后我特意去学了一下turtle模块,现在给大家分享一下. 一.什么是turtle Turtle是python内嵌的绘制线.圆以及其他形状(包括文本)的图形模块. 二.turtle函数的使用 import turtle turtle.pendown() # 放下画笔 turtle.penup() # 抬起画笔 turtle.pensize(int) # 设置画笔宽度,值为
-
教你利用python的matplotlib(pyplot)绘制折线图和柱状图
目录 前言 一.折线图 二.柱状图 总结 前言 今天帮师兄赶在deadline之前画论文的图,现学现卖很是刺激,现把使用matplotlib的子库pyplot画折线图和柱状图的代码记录分享一下,方便大家参考,个人感觉pyplot真的蛮方便的,非常值得使用. 先看下官方对pyplot的描述:“Provides a MATLAB-like plotting framework.”.对,就是一个类似matlab的画图框架.就不多多说了,直接上代码吧: 一.折线图 代码: import matplotl