matplotlib源码解析标题实现(窗口标题,标题,子图标题不同之间的差异)
在matplotlib中常用的标题主要三种:窗口标题、图像标题和子图标题。
先通过三个案例简要说明这三类标题的实现。
窗口标题、图像标题,子图标题(仅1个子图)

import matplotlib.pyplot as plt

plt.rcParams['font.sans-serif'] = 'SimHei'

fig = plt.figure()
plt.plot([1, 2])
# 设置图像标题
plt.suptitle("这是图像标题")
# 设置子图标题
plt.title("这是子图标题")
# 获取默认窗口标题
current_title = fig.canvas.manager.window.windowTitle()
print("默认窗口:",current_title)
# 设置窗口标题方式一
fig.canvas.set_window_title("这是窗口标题")
# 设置窗口标题方式二
fig.canvas.manager.window.setWindowTitle("这是窗口标题")

plt.show()
窗口标题、图像标题、子图标题(多子图)
使用subplot函数实现子图
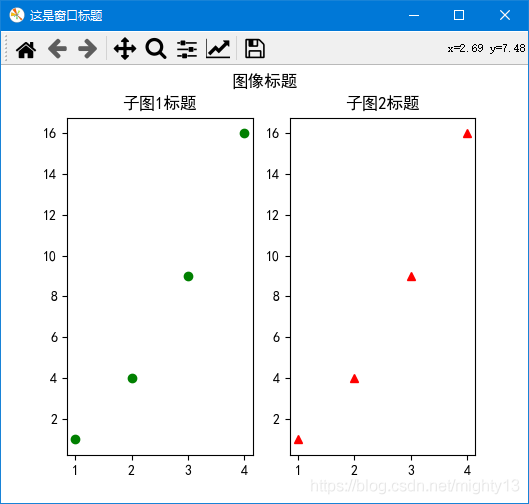
import matplotlib.pyplot as plt

plt.rcParams['font.sans-serif'] = 'SimHei'

fig = plt.figure()
plt.subplot(1, 2, 1)
plt.plot([1,2,3,4], [1,4,9,16], "go")
# 设置子图1标题
plt.title("子图1标题")

plt.subplot(122)
plt.plot([1,2,3,4], [1,4,9,16], "r^") # r^ 表示 红色(red)三角
# 设置子图2标题
plt.title("子图2标题")
# 设置图像标题
plt.suptitle("图像标题")
# 设置窗口标题
#fig.canvas.set_window_title("这是窗口标题")
fig.canvas.manager.window.setWindowTitle("这是窗口标题")

plt.show()
使用subplots函数subplots实现子图
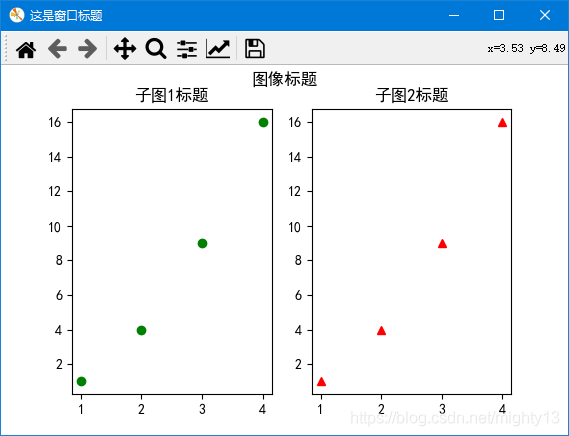
import matplotlib.pyplot as plt

plt.rcParams['font.sans-serif'] = 'SimHei'

fig, ax = plt.subplots(nrows=1, ncols=2, figsize=(6,6))
ax[0].plot([1,2,3,4], [1,4,9,16], "go")
# 设置子图1标题
ax[0].set_title("子图1标题")
ax[1].plot([1,2,3,4], [1,4,9,16], "r^")
# 设置子图2标题
ax[1].set_title("子图2标题")
# 设置图像标题
plt.suptitle("图像标题")
# 设置窗口标题
fig.canvas.manager.window.setWindowTitle("这是窗口标题")

plt.show()
原理分析
通过前面三个案例可知:
窗口标题
设置窗口标题可以用两种方法:
一种是调用figure.canvas对象的set_window_title方法,一种是figure.canvas.manager.window对象的setWindowTitle方法。通过下面源码可知,这两种方法其实是等价的。
因此在日常实现过程中,关键是获取当前图像对象(figure),即案例中的fig。该方法只有一个参数,类型为字符串。
可以通过
通过figure.canvas.manager.window对象的windowTitle方法可以获取窗口标题。
class FigureManagerQT(FigureManagerBase):
  def set_window_title(self, title):
    self.window.setWindowTitle(title)
图像标题
调用plt.suptitle函数即可。根据源码可知,plt.suptitle函数其实是调用了当前figure对象的suptitle方法。
suptitle函数参数
  def suptitle(self, t, **kwargs):
    """
    Add a centered title to the figure.

    Parameters
    ----------
    t : str
      The title text.

    x : float, default 0.5
      The x location of the text in figure coordinates.

    y : float, default 0.98
      The y location of the text in figure coordinates.

    horizontalalignment, ha : {'center', 'left', right'}, default: 'center'
      The horizontal alignment of the text relative to (*x*, *y*).

    verticalalignment, va : {'top', 'center', 'bottom', 'baseline'}, \
default: 'top'
      The vertical alignment of the text relative to (*x*, *y*).

    fontsize, size : default: :rc:`figure.titlesize`
      The font size of the text. See `.Text.set_size` for possible
      values.

    fontweight, weight : default: :rc:`figure.titleweight`
      The font weight of the text. See `.Text.set_weight` for possible
      values.

    Returns
    -------
    text
      The `.Text` instance of the title.

    Other Parameters
    ----------------
    fontproperties : None or dict, optional
      A dict of font properties. If *fontproperties* is given the
      default values for font size and weight are taken from the
      `.FontProperties` defaults. :rc:`figure.titlesize` and
      :rc:`figure.titleweight` are ignored in this case.

    **kwargs
      Additional kwargs are `matplotlib.text.Text` properties.

    Examples
    --------
    >>> fig.suptitle('This is the figure title', fontsize=12)
    """
子图标题
- 使用
subplot函数:在所在子图中,使用plt.title函数。 - 使用
subplots函数:使用子图对象调用set_title方法。 plt.title函数和axes.set_title方法的参数相同。
注意,在使用subplots函数创建子图时,为什么不能使用plt.title函数设置子图标题呢?
根据title函数的源码可知,title函数其实是通过gca()函数获取子图,然后再调用set_title方法设置标题的。根据实验,在使用subplots函数函数创建多个子图时,plt.gca()只能得到最后一个子图的标题,因此,在某些情况下使用plt.title函数可设置最后一个子图的标题。
plt.title函数和axes.set_title方法源码
def title(label, fontdict=None, loc=None, pad=None, *, y=None, **kwargs):
  return gca().set_title(
    label, fontdict=fontdict, loc=loc, pad=pad, y=y, **kwargs)
Axes.set_title(self, label, fontdict=None, loc=None, pad=None, *, y=None, **kwargs):
  """
  Set a title for the axes.

  Set one of the three available axes titles. The available titles
  are positioned above the axes in the center, flush with the left
  edge, and flush with the right edge.

  Parameters
  ----------
  label : str
    Text to use for the title

  fontdict : dict
    A dictionary controlling the appearance of the title text,
    the default *fontdict* is::

      {'fontsize': rcParams['axes.titlesize'],
      'fontweight': rcParams['axes.titleweight'],
      'color': rcParams['axes.titlecolor'],
      'verticalalignment': 'baseline',
      'horizontalalignment': loc}

  loc : {'center', 'left', 'right'}, default: :rc:`axes.titlelocation`
    Which title to set.

  y : float, default: :rc:`axes.titley`
    Vertical axes loation for the title (1.0 is the top). If
    None (the default), y is determined automatically to avoid
    decorators on the axes.

  pad : float, default: :rc:`axes.titlepad`
    The offset of the title from the top of the axes, in points.

  Returns
  -------
  `.Text`
    The matplotlib text instance representing the title

  Other Parameters
  ----------------
  **kwargs : `.Text` properties
    Other keyword arguments are text properties, see `.Text` for a list
    of valid text properties.
  """
plt.gca()实验
import matplotlib.pyplot as plt

plt.rcParams['font.sans-serif'] = 'SimHei'

fig, ax = plt.subplots(nrows=1, ncols=2, figsize=(6,6))
ax[0].plot([1,2,3,4], [1,4,9,16], "go")
ax[1].plot([1,2,3,4], [1,4,9,16], "r^")

print(plt.gca())
print(ax[0],ax[1])
结果为
AxesSubplot(0.547727,0.11;0.352273x0.77)
AxesSubplot(0.125,0.11;0.352273x0.77) AxesSubplot(0.547727,0.11;0.352273x0.77)
到此这篇关于matplotlib源码解析标题实现(窗口标题,标题,子图标题不同之间的差异)的文章就介绍到这了,更多相关matplotlib 标题内容请搜索我们以前的文章或继续浏览下面的相关文章希望大家以后多多支持我们!
相关推荐
-

Python使用matplotlib模块绘制图像并设置标题与坐标轴等信息示例
本文实例讲述了Python使用matplotlib模块绘制图像并设置标题与坐标轴等信息.分享给大家供大家参考,具体如下: 进行图像绘制有时候需要设定坐标轴以及图像标题等信息,示例代码如下: #-*- coding: utf-8 -*- #!/usr/bin/python import matplotlib.pyplot as plt from numpy.random import randn x = range(100) y = randn(100) fig = plt.figure() ax
-
Python使用Matplotlib模块时坐标轴标题中文及各种特殊符号显示方法
本文实例讲述了Python使用Matplotlib模块时坐标轴标题中文及各种特殊符号显示方法.分享给大家供大家参考,具体如下: Matplotlib中文显示问题--用例子说明问题 #-*- coding: utf-8 -*- from pylab import * t = arange(-4*pi, 4*pi, 0.01) y = sin(t)/t plt.plot(t, y) plt.title('www.jb51.net - test') plt.xlabel(u'\u2103',fontp
-
matplotlib subplots 设置总图的标题方法
如下所示: matplotlib subplots 设置总图的标题 : fig.suptitle(dname,fontsize=16,x=0.53,y=1.05,) 以上这篇matplotlib subplots 设置总图的标题方法就是小编分享给大家的全部内容了,希望能给大家一个参考,也希望大家多多支持我们.
-
matplotlib源码解析标题实现(窗口标题,标题,子图标题不同之间的差异)
在matplotlib中常用的标题主要三种:窗口标题.图像标题和子图标题. 先通过三个案例简要说明这三类标题的实现. 窗口标题.图像标题,子图标题(仅1个子图) import matplotlib.pyplot as plt plt.rcParams['font.sans-serif'] = 'SimHei' fig = plt.figure() plt.plot([1, 2]) # 设置图像标题 plt.suptitle("这是图像标题") # 设置子图标题 plt.title(&q
-
jq源码解析之绑在$,jQuery上面的方法(实例讲解)
1.当我们用$符号直接调用的方法.在jQuery内部是如何封装的呢?有没有好奇心? // jQuery.extend 的方法 是绑定在 $ 上面的. jQuery.extend( { //expando 用于决定当前页面的唯一性. /\D/ 非数字.其实就是去掉小数点. expando: "jQuery" + ( version + Math.random() ).replace( /\D/g, "" ), // Assume jQuery is ready wit
-
AngularJS动态生成div的ID源码解析
1.问题背景 给定一个数组对象,里面是div的id:循环生成div元素,并给id赋值 2.实现源码 <!DOCTYPE html> <html> <head> <meta charset="UTF-8"> <title>AngularJS动态生成div的ID</title> <script src="http://apps.bdimg.com/libs/angular.js/1.4.6/angula
-
Java源码解析之TypeVariable详解
TypeVariable,类型变量,描述类型,表示泛指任意或相关一类类型,也可以说狭义上的泛型(泛指某一类类型),一般用大写字母作为变量,比如K.V.E等. 源码 public interface TypeVariable<D extends GenericDeclaration> extends Type { //获得泛型的上限,若未明确声明上边界则默认为Object Type[] getBounds(); //获取声明该类型变量实体(即获得类.方法或构造器名) D getGenericDe
-
Java源码解析之GenericDeclaration详解
学习别人实现某个功能的设计思路,来提高自己的编程水平.话不多说,下面进入正题. GenericDeclaration 可以声明类型变量的实体的公共接口,也就是说,只有实现了该接口才能在对应的实体上声明(定义)类型变量,这些实体目前只有三个:Class(类).Construstor(构造器).Method(方法)(详见:Java源码解析之TypeVariable详解 源码 public interface GenericDeclaration { //获得声明列表上的类型变量数组 public T
-
Java源码解析之object类
在源码的阅读过程中,可以了解别人实现某个功能的涉及思路,看看他们是怎么想,怎么做的.接下来,我们看看这篇Java源码解析之object的详细内容. Java基类Object java.lang.Object,Java所有类的父类,在你编写一个类的时候,若无指定父类(没有显式extends一个父类)编译器(一般编译器完成该步骤)会默认的添加Object为该类的父类(可以将该类反编译看其字节码,不过貌似Java7自带的反编译javap现在看不到了). 再说的详细点:假如类A,没有显式继承其他类,编译
-
详解vue mint-ui源码解析之loadmore组件
本文介绍了vue mint-ui源码解析之loadmore组件,分享给大家,具体如下: 接入 官方接入文档mint-ui loadmore文档 接入使用Example html <div id="app"> <mt-loadmore :top-method="loadTop" :bottom-method="loadBottom" :bottom-all-loaded="allLoaded" :max-dis
-
vue loadmore 组件滑动加载更多源码解析
上一篇讲到在项目中使用上拉加载更多组件,但是由于实际项目开发中由于需求变更或者说在webview中上拉加载有些机型在上拉时候会把webview也一起上拉导致上拉加载不灵敏等问题,我们有时候也会换成滑动到底部自动加载的功能. 既然都是加载更多,很多代码思想势必相似,主要区别在于上拉和滑动到底部这个操作上,所以,我们需要注意: 上拉加载是point指针touch触摸事件,现在因为是滑动加载,需要添加scroll事件去监听然后执行相应回调 上拉加载主要计算触摸滚动距离,滑动加载主要计算containe
-
.properties文件读取及占位符${...}替换源码解析
前言 我们在开发中常遇到一种场景,Bean里面有一些参数是比较固定的,这种时候通常会采用配置的方式,将这些参数配置在.properties文件中,然后在Bean实例化的时候通过Spring将这些.properties文件中配置的参数使用占位符"${}"替换的方式读入并设置到Bean的相应参数中. 这种做法最典型的就是JDBC的配置,本文就来研究一下.properties文件读取及占位符"${}"替换的源码,首先从代码入手,定义一个DataSource,模拟一下JDB
-
Redis源码解析:集群手动故障转移、从节点迁移详解
一:手动故障转移 Redis集群支持手动故障转移.也就是向从节点发送"CLUSTER FAILOVER"命令,使其在主节点未下线的情况下,发起故障转移流程,升级为新的主节点,而原来的主节点降级为从节点. 为了不丢失数据,向从节点发送"CLUSTER FAILOVER"命令后,流程如下: a:从节点收到命令后,向主节点发送CLUSTERMSG_TYPE_MFSTART包: b:主节点收到该包后,会将其所有客户端置于阻塞状态,也就是在10s的时间内