基于TensorBoard中graph模块图结构分析

在上一篇文章中,我们介绍了如何使用源码对TensorBoard进行编译教程,没有定制需求的可以直接使用pip进行安装。

TensorBoard中的graph是一种计算图,里面的点用于表示Tensor本身或者运算符,图中的边则代表Tensor的流动或者控制关系。
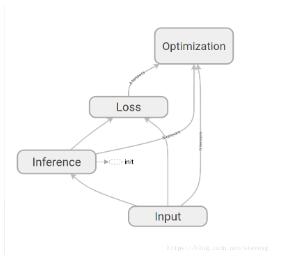
本文主要从代码的层面,分析graph的数据来源与结构。

一般来说,我们在启动TensorBoard的时候会使用--logdir参数配置文件路径(或者设置数据库位置),这些日志文件为TensorBoard提供了数据。于是我们打开一个日志文件,查看里面的内容
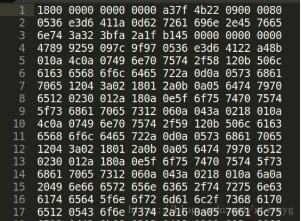
我们看到,文件是通过二进制展示的,因此无法直接读取文件的内容。

回到浏览器中,进入graph页面,通过开发者工具发现,构造图的时候调用了一个接口

http://localhost:6006/data/plugin/graphs/graph?large_attrs_key=_too_large_attrs&limit_attr_size=1024&run=task1

用浏览器打开这个地址,看到以下内容

node {
 name: "Input/X"
 op: "Placeholder"
 attr {
 key: "_output_shapes"
 value {
  list {
  shape {
   unknown_rank: true
  }
  }
 }
 }
 attr {
 key: "dtype"
 value {
  type: DT_FLOAT
 }
 }
 attr {
 key: "shape"
 value {
  shape {
  unknown_rank: true
  }
 }
 }
}
...

每个node都能够与图中的一个节点相对应,因此我们可以确定,这个接口里返回的node,就是构成图所需要的数据结构。

那么,TensorBoard是如何将日志文件转化为图的呢?

TesnorBoard中的每个模块都是以plugin存在的,我们进入tensorboard/plugin/graph/graphs_plungin.py,在这个文件中定义了graph相关的接口

def get_plugin_apps(self):
 return {
  '/graph': self.graph_route,
  '/runs': self.runs_route,
  '/run_metadata': self.run_metadata_route,
  '/run_metadata_tags': self.run_metadata_tags_route,
 }

我们可以看到,‘/graph'这个接口返回值为self.graph_route,在这个文件中搜索graph_route方法

 @wrappers.Request.application
 def graph_route(self, request):
 """Given a single run, return the graph definition in protobuf format."""
 run = request.args.get('run')
 if run is None:
  return http_util.Respond(
   request, 'query parameter "run" is required', 'text/plain', 400)

 limit_attr_size = request.args.get('limit_attr_size', None)
 if limit_attr_size is not None:
  try:
  limit_attr_size = int(limit_attr_size)
  except ValueError:
  return http_util.Respond(
   request, 'query parameter `limit_attr_size` must be an integer',
   'text/plain', 400)

 large_attrs_key = request.args.get('large_attrs_key', None)

 try:
  result = self.graph_impl(run, limit_attr_size, large_attrs_key)
 except ValueError as e:
  return http_util.Respond(request, e.message, 'text/plain', code=400)
 else:
  if result is not None:
  (body, mime_type) = result # pylint: disable=unpacking-non-sequence
  return http_util.Respond(request, body, mime_type)
  else:
  return http_util.Respond(request, '404 Not Found', 'text/plain',
         code=404)

在这个方法中,分别取了“run”,”limit_attr_size“和“large_attrs_key”三个参数,和前面url所调用的参数一致,说明这个是我们要找的方法。在方法的最后,调用了self.graph_impl生成了图,我们继续查看这个方法

def graph_impl(self, run, limit_attr_size=None, large_attrs_key=None):
 """Result of the form `(body, mime_type)`, or `None` if no graph exists."""
 try:
  graph = self._multiplexer.Graph(run)
 except ValueError:
  return None
 # This next line might raise a ValueError if the limit parameters
 # are invalid (size is negative, size present but key absent, etc.).
 process_graph.prepare_graph_for_ui(graph, limit_attr_size, large_attrs_key)
 return (str(graph), 'text/x-protobuf') # pbtxt

这个方法调用了self._multiplexer.Graph(run)生成图。_multiplexer是一个event_multiplexer实例,在graph_plugln初始化时通过base_plaugin.TBContext获得。

 def __init__(self, context):
 """Instantiates GraphsPlugin via TensorBoard core.
 Args:
  context: A base_plugin.TBContext instance.
 """
 self._multiplexer = context.multiplexer

进入tensorboard/backend/event_processing/event_multiplexer,找到Graph方法

def Graph(self, run):
 """Retrieve the graph associated with the provided run.
 Args:
  run: A string name of a run to load the graph for.
 Raises:
  KeyError: If the run is not found.
  ValueError: If the run does not have an associated graph.
 Returns:
  The `GraphDef` protobuf data structure.
 """
 accumulator = self.GetAccumulator(run)
 return accumulator.Graph()

 def GetAccumulator(self, run):
 """Returns EventAccumulator for a given run.
 Args:
  run: String name of run.
 Returns:
  An EventAccumulator object.
 Raises:
  KeyError: If run does not exist.
 """
 with self._accumulators_mutex:
  return self._accumulators[run]

Graph方法获取了run对应的accumulator实例,并返回了这个实例的Graph方法的返回值。我们进入tensorboard/backend/event_processing/event_accumulator,找到Graph()方法

 def Graph(self):
 """Return the graph definition, if there is one.
 If the graph is stored directly, return that. If no graph is stored
 directly but a metagraph is stored containing a graph, return that.
 Raises:
  ValueError: If there is no graph for this run.
 Returns:
  The `graph_def` proto.
 """
 graph = tf.GraphDef()
 if self._graph is not None:
  graph.ParseFromString(self._graph)
  return graph
 raise ValueError('There is no graph in this EventAccumulator')

事实上,它返回了一个GraphDef图,因此我们也可以通过将日志转换为GraphDef的方式读取日志。

# 导入要用到的基本模块。为了在python2、python3 中可以使用E侣兼容的 print 函数
from __future__ import print_function
import numpy as np
import tensorflow as tf

# 创建图和Session
graph = tf.Graph()
sess = tf.InteractiveSession(graph=graph)

#日志路径
model_fn = '/log/events.out.tfevents.1535957014.ubuntu'

for e in tf.train.summary_iterator(model_fn):
 if e.HasField('graph_def'):
  graph = e.graph_def;
  graph_def = tf.GraphDef()
  graph_def.ParseFromString(graph)
  print(graph_def)

我们新建一个python文件,修改日志路径为自己的日志位置,便可以得到与TensorBoard相同的内容。

以上这篇基于TensorBoard中graph模块图结构分析就是小编分享给大家的全部内容了,希望能给大家一个参考,也希望大家多多支持我们。

(0)

相关推荐

  • 解决Tensorboard 不显示计算图graph的问题

    问 题:直接载入TensorBoard 总是提示No dashboard are active for current data set.根本不显示计算图. 原 因:文件路径问题,TensorBoard 未读取到文件数据,自然无法显示结果. 解决方法:设置文件路径. 程序运行完后在cmd 运行栏输入TensorBoard –logdir='graph文件所在的文件夹的路径'.为简化输入路径,可直接在该文件夹所在的文件夹中启动cmd. 以上这篇解决Tensorboard 不显示计算图graph的问

  • TensorFlow命名空间和TensorBoard图节点实例

    一,命名空间函数 tf.variable_scope tf.name_scope 先以下面的代码说明两者的区别 # 命名空间管理函数 ''' 说明tf.variable_scope和tf.name_scope的区别 ''' def manage_namespace(): with tf.variable_scope("foo"): # 在命名空间foo下获取变量"bar",于是得到的变量名称为"foo/bar". a = tf.get_varia

  • 解决Tensorboard可视化错误:不显示数据 No scalar data was found

    学习Tensorboard过程中,按照书本中操作,结果在浏览器中报错:No scalar data was found. 通过百度查询,自己琢磨,发现有个小问题觉得写出来供像我这样的菜鸟注意. 我的环境是:window,Anaconda2底下安装python2.7,又加装了tensorfow环境和Python3.5 1.使用Jupyter Note book写代码注意 相对路径: writer = tf.summary.FileWriter('logs/',sess.graph),注意单引号 绝

  • 使用Bazel编译TensorBoard教程

    1.TensorBoard Tensorboard是一套用于查看和理解TensorFlow运行情况的工具,有时可能现有的功能并不能满足我们当前的需求,那么则需要我们对Tensorboard进行定制化开发,定制化的第一步就是编译源码. TensorBoard已在github上开源,我们可以通过https://github.com/tensorflow/tensorboard获取到完整的代码.包括TensorBoard在内,Google的很多项目都是使用Bazel进行编译的,接下来我们进行相关环境的

  • TensorBoard 计算图的查看方式

    Tensorflow计算图的展示: 1. 设置生成计算图,运行程序会自动生成"logs"日志文件 2. 在Terminal下输入指令 如果当前路径为程序日志路径(即"logs"所在路径),直接输入指令 tensorboard --logdir = logs 如果当前路径不是程序日志路径(即"logs"所在路径),可以 cd "日志的绝对路径"进入"logs"所在的路径,或者 直接输入指令 tensorboa

  • 对Tensorflow中tensorboard日志的生成与显示详解

    TensorBoard是TensorFlow下的一个可视化的工具,能够帮助我们在训练大规模神经网络过程中出现的复杂且不好理解的运算.TensorBoard能展示你训练过程中绘制的图像.网络结构等. 1. 构建简单的TensorBoard日志输出 import tensorflow as tf input1 = tf.constant([1.0, 2.0, 3.0], name="input1") input2 = tf.Variable(tf.random_uniform([3], n

  • TensorBoard 计算图的可视化实现

    简介 tensorflow 配套的可视化工具, 将你的计算图画出来. 当训练一个巨大的网络的时候, 计算图既复杂又令人困惑. TensorBoard 提供了一系列的组件, 可以看到 learning rate 的变化, 看到 objective function 的变化. tfboard 读取 tf 运行时你记下的 events files, 来进行可视化. 这些 events files 包含了你记下的 summary data, 它是 protobuffer 格式, 并非文本文件. 推荐使用

  • tensorboard 可以显示graph,却不能显示scalar的解决方式

    今天照着样例搞了下tensorboard,发现自己无法显示scalar,而graph却可以正常显示. 出现这种情况就说明,tensorfboard已经正确读取了指定目录下的数据,只是数据里没有保存有scalar数据. 这很奇怪,我反反复复检查了好多遍代码都觉得没问题. 最好查了一个下午,也搞了一个下午,终于被我发现问题所在.我把下面这代码放错位置了. summary_op=tf.summary.merge_all() 原位置如下: 我把summary_op给放再with tf.Session()

  • 基于TensorBoard中graph模块图结构分析

    在上一篇文章中,我们介绍了如何使用源码对TensorBoard进行编译教程,没有定制需求的可以直接使用pip进行安装. TensorBoard中的graph是一种计算图,里面的点用于表示Tensor本身或者运算符,图中的边则代表Tensor的流动或者控制关系. 本文主要从代码的层面,分析graph的数据来源与结构. 一般来说,我们在启动TensorBoard的时候会使用--logdir参数配置文件路径(或者设置数据库位置),这些日志文件为TensorBoard提供了数据.于是我们打开一个日志文件

  • 基于python中pygame模块的Linux下安装过程(详解)

    一.使用pip安装Python包 大多数较新的Python版本都自带pip,因此首先可检查系统是否已经安装了pip.在Python3中,pip有时被称为pip3. 1.在Linux和OS X系统中检查是否安装了pip 打开一个终端窗口,并执行如下命令: Python2.7中: zhuzhu@zhuzhu-K53SJ:~$ pip --version pip 8.1.1 from /usr/lib/python2.7/dist-packages (python 2.7) Python3.X中: z

  • 基于Pygame中Pygame模块的大战外星人实战

    目录 一,引言 二,主要内容 效果展示:  游戏介绍: 一,引言 开发环境:Pycharm 操作系统:Windows 10 Pyhon版本:3.9.9 需要自行安装Pygame 3(必须)和Python(必须). 由于多次引用背景参数,建议不要更改文中的背景参数.本文中的图片用的是相对引用的方式,如果和我图片位置放置不同的话需要设置绝对引用. 二,主要内容 主要代码片段: import sys import pygame # 调用pygame from settings import Setti

  • tensorflow通过模型文件,使用tensorboard查看其模型图Graph方式

    Google提供了一个工具,TensorBoard,它能以图表的方式分析你在训练过程中汇总的各种数据,其中包括Graph结构. 所以我们可以简单的写几行Pyhton,加载Graph,只在logdir里,输出Graph结构数据,并可以查看其图结构. 执行下述代码,将数据流图保存为图片,在目录F:/tensorflow/graph下生成文件events.out.tfevents.1508420019.XM-PC import tensorflow as tf from tensorflow.pyth

  • 基于Matplotlib 调用 pyplot 模块中 figure() 函数处理 figure图形对象

    在 Matplotlib 中,面向对象编程的核心思想是创建图形对象(figure object).通过图形对象来调用其它的方法和属性,这样有助于我们更好地处理多个画布.在这个过程中,pyplot 负责生成图形对象,并通过该对象来添加一个或多个 axes 对象(即绘图区域). Matplotlib 提供了matplotlib.figure图形类模块,它包含了创建图形对象的方法.通过调用 pyplot 模块中 figure() 函数来实例化 figure 对象. 如下所示: from matplot

  • 在vue中使用eacharts创建graph关系图方式

    目录 使用eacharts创建graph关系图 vue中关系图组件 1.Graph.vue 2.GraphDemo.vue 使用eacharts创建graph关系图 在最近的工作中遇到了这个问题一开始遇到遇到问题且网上现在的教程不那么详细于是想着自己写一个来记录一下. 首先想使用echarts先下载echarts包命令如下 npm install echarts --save 然后将eacharts引入到项目中,推荐在main.js引入. import * as echarts from 'ec

  • Nginx服务器中的模块编写及相关内核源码初探

    1.nginx模块 首先nginx和apache最大的不同就是nginx的模块不能够动态添加,需要在编译时,指定要添加的模块路径,与nginx源码一起编译. nginx模块的处理流程: a.客户端发送http请求到nginx服务器 b.nginx基于配置文件中的位置选择一个合适的处理模块 c.负载均衡模块选择一台后端服务器(反向代理情况下) d.处理模块进行处理并把输出缓冲放到第一个过滤模块上 e.第一个过滤模块处理后输出给第二个过滤模块 f.然后第二个过滤模块又到第三个过滤模块 g.第N个过滤

  • Java语言基于无向有权图实现克鲁斯卡尔算法代码示例

    所谓有权图,就是图中的每一条边上都会有相应的一个或一组值.通常情况下,这个值只是一个数字 如:在交通运输网中,边上的权值可能表示的是路程,也可能表示的是运输费用(显然二者都是数字).不过,边上的权值也有可能是其它东西,比如说是一个字符串,甚至是一个更加复杂的数据包,里面集合了更多的数据 克鲁斯卡尔算法的核心思想是:在带权连通图中,不断地在边集合中找到最小的边,如果该边满足得到最小生成树的条件,就将其构造,直到最后得到一颗最小生成树. 克鲁斯卡尔算法的执行步骤: 第一步:在带权连通图中,将边的权值

  • 基于keras中的回调函数用法说明

    keras训练 fit( self, x, y, batch_size=32, nb_epoch=10, verbose=1, callbacks=[], validation_split=0.0, validation_data=None, shuffle=True, class_weight=None, sample_weight=None ) 1. x:输入数据.如果模型只有一个输入,那么x的类型是numpy array,如果模型有多个输入,那么x的类型应当为list,list的元素是对应

  • 基于python select.select模块通信的实例讲解

    要理解select.select模块其实主要就是要理解它的参数, 以及其三个返回值. select()方法接收并监控3个通信列表, 第一个是所有的输入的data,就是指外部发过来的数据,第2个是监控和接收所有要发出去的data(outgoing data),第3个监控错误信息在网上一直在找这个select.select的参数解释, 但实在是没有, 哎...自己硬着头皮分析了一下. readable, writable, exceptional = select.select(inputs, ou

随机推荐