Vue结合openlayers按照经纬度坐标实现锚地标记及绘制多边形区域
目录
- 前言
- 1.安装openlayers
- 2.引入模块
- 3.地图与弹窗html样式
- 4.data数据定义
- 5.methods方法
- 6.mounted数据加载
- 7.锚地数据获取
前言
本文介绍vue结合openlayers实现根据返回的经纬度坐标完成锚地标记、绘制多边形区域;
注意点:
1.根据返回的经纬度取第一个坐标作为锚地图标位置;
2.根据返回的经纬度坐标数据,这里的后台数据需要处理(根据返回的数据处理成需要的格式),得到坐标数组渲染绘制区域画图显示在航道图层上。
3.关于数据渲染的问题:
这里前端采用的是获取左下角和右上角经纬度作为参数传递给后台获取当前屏幕显示的区域的数据。利用滑动地图区域来请求接口渲染数据,这样就很好的解决了一次性加载很多的数据的问题。
文章内容较长,花费时间需要一些时间,如果有疑问可留言、评论;以往也有发布关于openlayers的其它文章,可在本博客订阅搜索查看。
openlayers官方文档学习:
实现效果图预览:


实现步骤:
1.安装openlayers
cnpm i -S ol
#或者
npm install ol
2.引入模块
// openlayers地图
import "ol/ol.css";
import { Icon, Style ,Text,Fill,Stroke,Circle as CircleStyle} from "ol/style";
import Map from "ol/Map";
import View from "ol/View";
// import OSM from "ol/source/OSM";
import TileLayer from "ol/layer/Tile";
import XYZ from "ol/source/XYZ";
import { get as getProjection ,fromLonLat} from "ol/proj.js";
import { getBottomLeft, getTopRight } from "ol/extent.js";
import { Vector as SourceVec } from "ol/source";
import { Vector as LayerVec } from "ol/layer";
import Overlay from "ol/Overlay"; //弹窗
import { Point } from "ol/geom";
import { Feature } from "ol";
import Observable from 'ol/Observable';
import { defaults as defaultControls } from "ol/control"; //默认缩放
import { FullScreen, ScaleLine, ZoomSlider } from "ol/control"; //全屏,比例尺控件
import TileGrid from "ol/tilegrid/TileGrid";
import { LineString, Polygon } from "ol/geom.js";
import {defaults as defaultInteractions} from 'ol/interaction';//旋转
3.地图与弹窗html样式
<!-- 地图 -->
<div style="width:100%;height:100%">
    <div id="mapDiv"></div>
    <!-- 弹窗元素 -->
    <div class="popup serchPopup" ref="popup" v-show="shopPopup" >
                <div class="ship-header">
                  <div class="cname">{{anchorageName?anchorageName:""}}</div>
                      <img class="icon-close" @click="closePopup" src="../../assets/img/sy_close.png"/>
                </div>
    </div>
</div>
/* 弹窗样式 */
.popup {
  font-family: "微软雅黑";
  // min-width: 280px;
  position: relative;
  display: flex;
  flex-direction: column;
  transform: translate(-50%, calc(-100% - 12px));
  opacity: 0.95;
  background: #ffffff;
  border-radius: 24px;
  box-shadow: 0px 2px 20px 0px rgba(0, 0, 0, 0.15);
  // overflow: hidden;
  .content {
    margin-top: 6px;
  }
  .ship-header {
    padding: 20px 30px;
    display: flex;
    justify-content: space-between;
    align-items: center;
    .cname {
      font-weight: 600;
      font-size: 32px;
      color: #024ee0;
    }
  }
  .ship-content {
    padding: 30px;
    border-top: 1px solid #ececec;
    font-size: 24px;
    font-weight: 500;
    color: #535f8b;
    .con-sx {
      display: flex;
      justify-content: space-between;
      .txt-margin {
        margin-right: 60px;
      }
    }
  }
}
/* 弹窗下方的小三角形 */
.serchPopup::after {
    display: block;
    content: "";
    width: 0;
    height: 0;
    position: absolute;
    border: 12px solid transparent;
    border-top-color: #fff;
    bottom: -23px;
    left: 50%;
    transform: translateX(-50%);
}
/* 关闭弹窗按钮 */
.icon-close {
  cursor: pointer;
  width: 24px;
  height: 24px;
}
4.data数据定义
根据需要的自己补充
data(){
     // 地图
     map:null,
     cjinobeaconMap:null,
    //默认加载中心点
    center: {
        longitude: "114.293726",//114.293726   113.306100
        latitude: "30.577845",//30.577845  29.629998
    },
    anchorageIcon:require("../../assets/img/anchorage_icon.png"),//锚地图标
    anchorageVector:false,
    anchorageVectorLayer:null,
    anchorageFeatures:[],
    drawSource: null,
}
5.methods方法
初始化
initMap() {
      let defaultsMap = {
        tileUrl1:"图层数据地址",
        origin: [-400, 400],
        zoom: 7,
        resolutions: [
          //根据需求添加区域
        ],
        fullExtent: [
          //根据需求添加区域
        ],
        inters: [1000, 100],
        center: [this.center.longitude, this.center.latitude],
        projection: getProjection("EPSG:4326")
      };
      // 航道图层
      this.cjinobeaconMap = new TileLayer({
        source: new XYZ({
          tileGrid: tileGrid,
          projection: defaultsMap.projection,
          url: defaultsMap.tileUrl1
        }),
        zIndex: 9
      });
      // 弹窗
      this.overlay = new Overlay({
        element: this.$refs.popup, // 弹窗标签,在html里
        autoPan: true, // 如果弹窗在底图边缘时,底图会移动
        autoPanAnimation: {
          // 底图移动动画
          duration: 250
        },
        stopEvent: false,
        offset: [0, -10],
        className:"popupOverlay",
      });
      // 加载地图
      this.map = new Map({
        target: "mapDiv",
        controls: defaultControls().extend([
          new FullScreen(),
          new ScaleLine({
            units: "metric"
          })
          // new ZoomSlider()
        ]),
        interactions: defaultInteractions({
          pinchRotate: false // 移动端禁止地图旋转
        }),
        loadTilesWhileAnimating: true,
        layers: [this.cjinobeaconMap],//保留航道图层
        overlays: [this.overlay], // 把弹窗加入地图
        view: new View({
          projection: defaultsMap.projection,
          center: defaultsMap.center,  center: [114.272172,30.564646],
          extent: defaultsMap.fullExtent,
          // resolutions: defaultsMap.resolutions,
          zoom: 14,
          // minZoom: 12,
          // maxZoom:17,
          //设置缩放级别为整数
          // constrainResolution: true,
          //关闭无级缩放地图
          smoothResolutionConstraint: false
        })
      });
      this.mapClick(); // 初始化地图成功后,给地图添加点击事件
      this.map.addEventListener("moveend", this.showView);//监听地图区域滑动
    },
动态显示图层
    showView() {
      let zoom = this.map.getView().getZoom();
      console.log(zoom,"缩放")
      this.map.getLayers().getArray().forEach((item) => {
          if (item.get("name") == "anchorageVectorLayer") {
                // 锚地,这里根据获取的层级显示隐藏数据
                if (zoom>13) {
                      item.setVisible(true);
                      this.getAnchorageData();
                    } else {
                      this.shopPopup = false;
                      item.setVisible(false);
                      this.map.removeLayer(this.mdVectorLayer);//锚地图标
                    }
                }
        });
    },
弹窗mapClick
// 弹窗
    mapClick() {
      this.map.on("singleclick", evt => {
        this.isShowSerchList = false;
        let pixel = this.map.getEventPixel(evt.originalEvent);
        let feature = this.map.forEachFeatureAtPixel(
          evt.pixel,
          feature => feature
        );
        if (feature) {
          console.log(feature,"feature")
          this.shipName = feature.values_.shipName; //Feature对象集合中的
          this.portName = feature.values_.portName?feature.values_.portName:feature.values_.name;//港口
          this.portId = feature.values_.portId;
          this.mmsi = feature.values_.mmsi;
          this.nature = feature.values_.nature;
          this.csx = feature.values_.csx;
          this.speed = feature.values_.speed;
          this.updateTime = feature.values_.updateTime;
          this.shipStatus=feature.values_.shipStatus;
          this.vipStatus=feature.values_.vipStatus;
          this.shipType = feature.values_.shipType;
          this.areaName = feature.values_.areaName;
          console.log(this.areaName,"this.areaName");
          this.lonAndLatData = feature.values_.lonAndLatData;
          // 锚地名字
          this.anchorageName = feature.values_.anchorageName;
          console.log(this.anchorageName,"this.anchorageName");
          let coordinates = feature.getGeometry().getCoordinates();
          console.log(coordinates, "coordinates当前坐标");
          this.longitude = coordinates[0];
          this.latitude = coordinates[1];
          // 锚地
          if(this.anchorageName){
            setTimeout(() => {
              this.overlay.setPosition(coordinates);
            }, 0);
          }
          if(this.anchorageName){
            this.shopPopup = true;
          }else{
            this.shopPopup = false;
          }
        } else {
          this.shopPopup = false;
        }
      });
    },
6.mounted数据加载
mounted(){
    this.initMap(); //加载地图
    this.getAnchorageData();//锚地
}
7.锚地数据获取
重要代码

// 获取锚地数据
    getAnchorageData(){
      let arr = this.map.getView().calculateExtent(this.map.getSize());//获取左下角和右上角经纬度
      let params = {
        leftLongitude: arr[0],
        leftLatitude: arr[1],
        rightLongitude: arr[2],
        rightLatitude: arr[3],
      }
      this.mdFeatures = [];
      this.mdMarker = [];
      homePageAnchorageData(params).then(res=>{
        if(res.code == 200){
              //
                //
              this.anchorageFeatures = res.data.map(item=>{
                return item.lonAndLatDatas;
              });
              //取第一个坐标
              const selectOneData = res.data.map(item=>{
                  return item.lonAndLatDatas[0];
              });
              const selectOneName = res.data.map(item=>{
                  return item.anchorageName;
              });
              console.log(selectOneName,"取第一个坐标名字");
              // 添加图标
              this.mdFeatures = selectOneData;
              this.mdFeatures.map((item, index) => {
                  this.mdMarker.push(
                      new Feature({
                        geometry: new Point([item[0], item[1]], "XY"),
                        anchorageName:selectOneName[index],
                        index: index
                      })
                  );
              });
              let mdIconStyles = [];
              this.mdMarker.forEach(item => {
                    mdIconStyles.push(
                        new Style({
                          image: new Icon({
                            src: this.anchorageIcon,
                            scale: 0.6,
                            anchor: [0.5, 0.9],// 偏移的 x 与 y 方向值,注意此值与 Cesium 等GIS库偏向方向正好相反
                          }),

                        })
                    );
              });
              let mdVectorSource = new SourceVec({
                features: this.mdMarker
              });
              this.mdVectorLayer = new LayerVec({
                name: "mdVectorLayer",
                source: mdVectorSource,
                style: (feature)=> {
                  let iconStyle = mdIconStyles[feature.values_.index];
                  return [iconStyle];
                },
                zIndex: 13
              });
              this.map.addLayer(this.mdVectorLayer);
              this.mdVector = true;
              // this.anchorageFeatures = [
              //   ["113.306100", "29.629998"],
              //   ["113.296623", "29.619303"],
              //   ["113.294041", "29.620805"],
              //   ["113.302937", "29.631876"]
              // ];
              // 画图层
              this.drawSource = new SourceVec({ wrapX: false })
              this.anchorageVectorLayer = new LayerVec({
                name: "anchorageVectorLayer",
                source: this.drawSource,
                style: function (feature) {
                  let styles = [
                    new Style({
                      stroke: new Stroke({
                        width: 2,
                        color: '#ff4e4e'
                      }),
                      fill: new Fill({
                        color: 'rgba(255, 78, 78, 0.2)'
                      }),
                    })
                  ]
                  var geometry = feature.getGeometry()
                  if (geometry instanceof LineString) {
                    geometry.forEachSegment(function (start, end) {
                      console.log(start,"start")
                      styles.push(new Style({
                        geometry: new Point(start),
                        image: new CircleStyle({
                          radius: 4,
                          snapToPixel: false,
                          fill: new Fill({
                            color: 'white'
                          }),
                          stroke: new Stroke({
                            color: '#FF0F0F',
                            width: 2
                          }),
                        })
                      }))
                    })
                  }
                  return styles
                },
                zIndex:12
              });
              this.anchorageFeatures.forEach(item=>{
                this.drawSource.addFeature(new Feature({
                  geometry: new Polygon([item])
                }));
              })
              this.map.addLayer(this.anchorageVectorLayer);
              this.anchorageVector = true;
        }
      })
    },
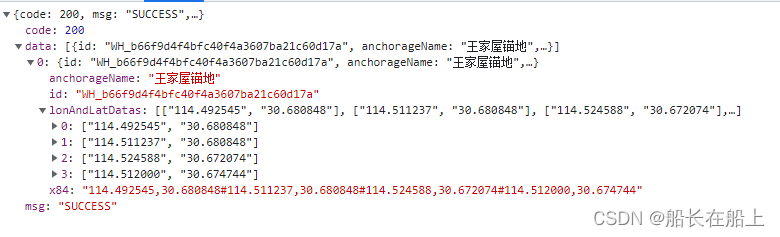
console.log打印的地方截图:


到此这篇关于Vue结合openlayers按照经纬度坐标实现锚地标记及绘制多边形区域的文章就介绍到这了,更多相关Vue 绘制多边形区域内容请搜索我们以前的文章或继续浏览下面的相关文章希望大家以后多多支持我们!
相关推荐
-

vue项目中openlayers绘制行政区划
vue项目中openlayers画行政区划(区域范围),供大家参考,具体内容如下 原理 在地图上画需要的范围,实际上就是在地图上打上一圈点,然后依次将这些点用线连接,就形成了范围 引用相应的ol模块 import VectorLayer from 'ol/layer/Vector' import VectorSource from 'ol/source/Vector' import { Map, View, Feature } from 'ol' import { Style, Icon, St
-
Vue使用openlayers实现绘制圆形和多边形
目录 绘制圆形 绘制多边形 绘制 编辑多边形 完成绘制 这个地方我就简单点写吧,因为一些东西比较乱,有的包啥的就按照官网API开发文档根据报错提示自己添加就可以了,我这个地方就不重复写了. 绘制圆形 这里的绘制圆是指当后台返回数据,告诉你以某个经纬度坐标为圆心,或者是顶点,以 r 为半径绘制,不是鼠标手动绘制. 首先绘制圆,首先有一个数据源和一个图层来存放绘制的圆形,这个很简单.然后创建变量自己该就可以,我估计都搞openlayer了,这些基础应该不至于不知道,我这边就写关键代码,我想应该没问题
-
vue+openlayers绘制省市边界线
本文实例为大家分享了vue+openlayers绘制省市边界线的具体代码,供大家参考,具体内容如下 1.创建项目 vue init webpack ol_vue 2.安装ol依赖包 npm install ol 3.引入axios npm install axios --save 文件目录:src/main.js import Vue from 'vue' import router from './router' import App from './App' import axios fro
-
Vue结合openlayers按照经纬度坐标实现锚地标记及绘制多边形区域
目录 前言 1.安装openlayers 2.引入模块 3.地图与弹窗html样式 4.data数据定义 5.methods方法 6.mounted数据加载 7.锚地数据获取 前言 本文介绍vue结合openlayers实现根据返回的经纬度坐标完成锚地标记.绘制多边形区域: 注意点: 1.根据返回的经纬度取第一个坐标作为锚地图标位置: 2.根据返回的经纬度坐标数据,这里的后台数据需要处理(根据返回的数据处理成需要的格式),得到坐标数组渲染绘制区域画图显示在航道图层上. 3.关于数据渲染的问题:
-
利用mongodb查询某坐标是否在规定多边形区域内的方法
前言 大家都知道MongoDB是一个基于分布式文件存储的数据库,并提供创建基于地理空间的索引的能力,本文将使用MongoDB 基于地理空间索引进行坐标所在区域的判断及使用. 1.使用百度拾取坐标工具,在地图上定义多边形的坐标点,并把每个点的坐标保存. 百度拾取坐标工具:http://api.map.baidu.com/lbsapi/getpoint/ 多边形的坐标点如下: 113.314882,23.163055 113.355845,23.167042 113.370289,23.149564
-
Vue+Openlayers实现实时坐标点展示
本文实例为大家分享了Vue+Openlayers实现实时坐标点展示的具体代码,供大家参考,具体内容如下 直接上代码 <!-- * @Description: 实时坐标点 * @Author: Dragon * @Date: 2020-12-18 10:08:40 * @LastEditTime: 2020-12-18 15:59:29 * @LastEditors: Dragon --> <template> <div id="map"&
-
vue利用openlayers加载天地图和高德地图
目录 一.天地图部分 1.在vue中安装openlayers 二.高德地图部分 一.天地图部分 1.在vue中安装openlayers npm i --save ol 这里说的vue是基于脚手架构建的. 新建个页面,也就是vue文件,配置好路由.接着就是可以直接放入我的代码运行显示了. <template> <div class="wrapper"> <div>天地图</div> <div class="map"
-
vue集成openlayers问题
目录 vue集成openlayers 下载依赖 创建地图文件 其他API vue openlayers绘制数据时鼠标位置偏移问题 解决方案 总结 vue集成openlayers 下载依赖 cnpm i -S ol 创建地图文件 <div class="map"></div> 按需引入相应的API,具体查看官方文档 <script> import Map from "ol/Map"; import View from "
-
vue使用openlayers实现移动点动画
本文实例为大家分享了vue使用openlayers实现移动点动画的具体代码,供大家参考,具体内容如下 做项目时,本来打算仿照官网的Example中动画制作,引入vue中后,发现它引用的库函数一直报错,最后我去vue中安装的依赖库中去查找这个函数,果然没有.也就是说官方例子使用的库和我安装的OL库存在一定差异. 后来我还是用笨方法去解决了,最终效果如下: 总体思路是将移动目标实例一个Overlay对象,然后将如图5个经纬度点没两点之间分割成多个(200个),之后通过定时器不断setPositon.
-
Vue利用openlayers实现点击弹窗的方法详解
目录 解释 编写弹窗 引入 openlayer使用弹窗组件 点击事件 这个写的稍微简单一点就行了,其实呢,这个不是很难,主要是知道原理就可以了. 我想实现的内容是什么意思呢?就是说页面上有很多坐标点,点击坐标点的时候在相应的位置弹出一个框,然后框里显示出这个坐标点的相关数据. 解释 这个内容的其实就是添加一个弹窗图层,然后在点击的时候让他显示出来罢了. 编写弹窗 首先一点,我们这个弹窗需要自己写一下,具体的样式,展示的内容之类的,所以说写一个弹窗组件,然后在openlayer文件中引用加载. 比
-
vue利用openlayers实现动态轨迹
目录 实现效果 创建一个地图容器 引入地图相关对象 创建地图对象 创建一条线路 画一条线路 添加起.终点 添加小车 准备开车 完整代码 实现效果 今天介绍一个有趣的gis小功能:动态轨迹播放!效果就像这样: 这效果看着还很丝滑!别急,接下来教你怎么实现.代码示例基于parcel打包工具和es6语法,本文假设你已经掌握相关知识和技巧. gis初学者可能对openlayers(后面简称ol)不熟悉,这里暂时不介绍ol了,直接上代码,先体验下感觉. 创建一个地图容器 引入地图相关对象 import M
-
地址到经纬度坐标转化的JAVA代码
任务:有1000多条门店信息(放在excel中,包括地址,店名,电话等,但是没有经纬度坐标),老大让我用地址通过百度地图拾取坐标系统找到相应的坐标,然后加上坐标后更新到公司的数据库. 失败的方案:1.使用按键精灵,按键精灵是一个模仿键盘鼠标操作的软件,用来写动作脚本的,由于时间紧,没怎么研究,因为整套动作太复杂了按键精灵尝试了下不行就放弃了. 2.表单填充工具(就是把exel表格批量提交到网页),什么风越.乌溜漆(特别是这乌溜漆,还要钱,坑货)都尝试了下,结果都不满意.因为我要把excel中的内