matplotlib之pyplot模块坐标轴标签设置使用(xlabel()、ylabel())

在pyplot模块中可以使用xlabel()ylabel()函数设置xy轴的标签。这两个函数的使用方法非常相似。

使用xlabel()设置x轴标签

函数签名为matplotlib.pyplot.xlabel(xlabel, fontdict=None, labelpad=None, *, loc=None, **kwargs)
参数作用及取值如下:

  • xlabel:类型为字符串,即标签的文本。
  • labelpad:类型为浮点数,默认值为None,即标签与坐标轴的距离。
  • loc:取值范围为{'left', 'center', 'right'},默认值为rcParams["xaxis.labellocation"]'center'),即标签的位置。
  • **kwargsText 对象关键字属性,用于控制文本的外观属性,如字体、文本颜色等。

返回值为Text对象。

xlabel()相关rcParams为:

#axes.labelsize:   medium # fontsize of the x any y labels
#axes.labelpad:   4.0   # space between label and axis
#axes.labelweight:  normal # weight of the x and y labels
#axes.labelcolor:  black
#xaxis.labellocation: center # alignment of the xaxis label: {left, right, center}

底层相关函数为:
Axes.set_xlabel(xlabel, fontdict=None, labelpad=None, *, loc=None, **kwargs)
Axes.get_xlabel()

案例

设置x轴标签,并输出xlabel函数的返回值。
返回值为Text对象,输出返回值的属性可知,标签文本的属性为_text。如果想获取标签文本,可使用Axes.get_xlabel方法获取。

import matplotlib.pyplot as plt

plt.plot([1, 1])
a = plt.xlabel("x")
print(a)
print(vars(a))
print(a._text)
print(plt.gca().get_xlabel())
plt.show()

输出:

Text(0.5, 0, 'x')
{'_stale': True, 'stale_callback': None, '_axes': None, 'figure': <Figure size 640x480 with 1 Axes>, '_transform': <matplotlib.transforms.BlendedAffine2D object at 0x0000019EC1471F98>, '_transformSet': True, '_visible': True, '_animated': False, '_alpha': None, 'clipbox': None, '_clippath': None, '_clipon': True, '_label': '', '_picker': None, '_contains': None, '_rasterized': None, '_agg_filter': None, '_mouseover': False, 'eventson': False, '_oid': 0, '_propobservers': {}, '_remove_method': None, '_url': None, '_gid': None, '_snap': None, '_sketch': None, '_path_effects': [], '_sticky_edges': _XYPair(x=[], y=[]), '_in_layout': True, '_x': 0.5, '_y': 0, '_text': 'x', '_color': 'black', '_fontproperties': <matplotlib.font_manager.FontProperties object at 0x0000019EC1471BE0>, '_usetex': False, '_wrap': False, '_verticalalignment': 'top', '_horizontalalignment': 'center', '_multialignment': None, '_rotation': None, '_bbox_patch': None, '_renderer': None, '_linespacing': 1.2, '_rotation_mode': None}
x
x

使用ylabel()设置y轴标签

函数签名为matplotlib.pyplot.ylabel(ylabel, fontdict=None, labelpad=None, *, loc=None, **kwargs)
参数作用及取值如下:

  • ylabel:类型为字符串,即标签的文本。
  • labelpad:类型为浮点数,默认值为None,即标签与坐标轴的距离。
  • loc:取值范围为{'bottom', 'center', 'top'},默认值为rcParams["yaxis.labellocation"]'center'),即标签的位置。
  • **kwargsText 对象关键字属性,用于控制文本的外观属性,如字体、文本颜色等。

返回值为Text对象。

xlabel()相关rcParams为:

#axes.labelsize:   medium # fontsize of the x any y labels
#axes.labelpad:   4.0   # space between label and axis
#axes.labelweight:  normal # weight of the x and y labels
#axes.labelcolor:  black
#yaxis.labellocation: center # alignment of the yaxis label: {bottom, top, center}

底层相关函数为:
Axes.set_ylabel(ylabel, fontdict=None, labelpad=None, *, loc=None, **kwargs)
Axes.get_ylabel()

案例

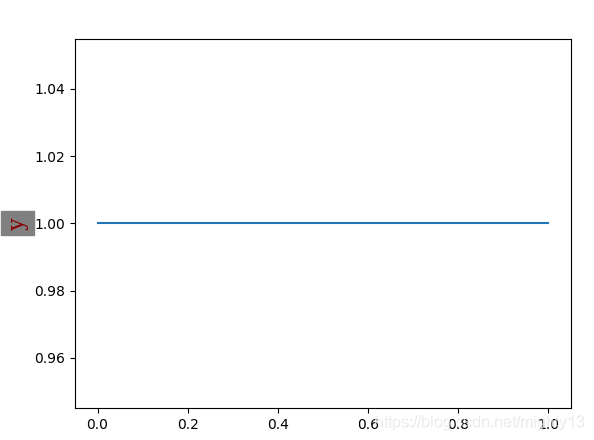
添加y轴标签,并设置字体属性和背景色。

import matplotlib.pyplot as plt

font = {'family': 'serif',
    'color': 'darkred',
    'weight': 'normal',
    'size': 16,
    }
plt.plot([1, 1])
plt.ylabel("y", fontdict=font, backgroundcolor='grey')

plt.show()
到此这篇关于matplotlib之pyplot模块坐标轴标签设置使用(xlabel()、ylabel())的文章就介绍到这了,更多相关matplotlib 坐标轴标签内容请搜索我们以前的文章或继续浏览下面的相关文章希望大家以后多多支持我们!

(0)

相关推荐

  • matplotlib 纵坐标轴显示数据值的实例

    实例如下所示: import matplotlib as mt import numpy as np y=[7,0,0,0,0,0,1,25,98,333,471,0,322,429,425,478,385,237,219,284,351,364,165,0] x=[1,2,3,4,5,6,7,8,9,10,11,12,13,14,15,16,17,18,19,20,21,22,23,24] x1=np.asanyarray(x) y1=np.asanyarray(y) import matpl

  • python matplotlib坐标轴设置的方法

    在使用matplotlib模块时画坐标图时,往往需要对坐标轴设置很多参数,这些参数包括横纵坐标轴范围.坐标轴刻度大小.坐标轴名称等 在matplotlib中包含了很多函数,用来对这些参数进行设置. 我们可以对坐标轴进行设置,设置坐标轴的范围,设置坐标轴上的文字描述等. 基本用法 例如: import numpy as np import pandas as pd import matplotlib.pyplot as plt # 生成x轴上的数据:从-3到3,总共有50个点 x = np.lin

  • 使用Python matplotlib作图时,设置横纵坐标轴数值以百分比(%)显示

    一.当我们用Python matplot时作图时,一些数据需要以百分比显示,以更方便地对比模型的性能提升百分比. 二.借助matplotlib.ticker.FuncFormatter(),将坐标轴格式化. 例子: # encoding=utf-8 import matplotlib.pyplot as plt from matplotlib.ticker import FuncFormatter plt.rcParams['font.family'] = ['Times New Roman']

  • 学习python中matplotlib绘图设置坐标轴刻度、文本

    总结matplotlib绘图如何设置坐标轴刻度大小和刻度. 上代码: from pylab import * from matplotlib.ticker import MultipleLocator, FormatStrFormatter xmajorLocator = MultipleLocator(20) #将x主刻度标签设置为20的倍数 xmajorFormatter = FormatStrFormatter('%1.1f') #设置x轴标签文本的格式 xminorLocator = M

  • python matplotlib画盒图、子图解决坐标轴标签重叠的问题

    在使用matplotlib画图的时候将常会出现坐标轴的标签太长而出现重叠的现象,本文主要通过自身测过好用的解决办法进行展示,希望也能帮到大家,原图出现重叠现象例如图1: 代码为: data1=[[0.3765,0.3765,0.3765,0.3765,0.3765],[0.3765,0.3765,0.3765,0.3765,0.3765],[0.3765,0.3765,0.3765,0.3765,0.3765],[0.3765,0.3765,0.3765,0.3765,0.3765]] data

  • Python绘图Matplotlib之坐标轴及刻度总结

    学习https://matplotlib.org/gallery/index.html 记录,描述不一定准确,具体请参考官网 Matplotlib使用总结图 import matplotlib.pyplot as plt plt.rcParams['font.sans-serif']=['SimHei'] # 用来正常显示中文标签 plt.rcParams['axes.unicode_minus']=False # 用来正常显示负号 import pandas as pd import nump

  • Python使用Matplotlib模块时坐标轴标题中文及各种特殊符号显示方法

    本文实例讲述了Python使用Matplotlib模块时坐标轴标题中文及各种特殊符号显示方法.分享给大家供大家参考,具体如下: Matplotlib中文显示问题--用例子说明问题 #-*- coding: utf-8 -*- from pylab import * t = arange(-4*pi, 4*pi, 0.01) y = sin(t)/t plt.plot(t, y) plt.title('www.jb51.net - test') plt.xlabel(u'\u2103',fontp

  • Python matplotlib学习笔记之坐标轴范围

    Python学习笔记--坐标轴范围 参靠视频:<Python数据可视化分析 matplotlib教程>链接:https://www.bilibili.com/video/av6989413/?p=6 所用的库及环境: IDE:Pycharm Python环境:python3.7 Matplotlib: Matplotlib 1.11 Numpy: Numpy1.15. 坐标轴范围 概念 根据需求调整坐标轴的范围 坐标轴范围调整 第一种形式 通过plt.axis()可以查看图形的x轴的最小最大坐

  • Python实现在matplotlib中两个坐标轴之间画一条直线光标的方法

    本文实例讲述了Python实现在matplotlib中两个坐标轴之间画一条直线光标的方法.分享给大家供大家参考.具体如下: 看看下面的例子和效果吧 # -*- coding: utf-8 -*- from matplotlib.widgets import MultiCursor from pylab import figure, show, np t = np.arange(0.0, 2.0, 0.01) s1 = np.sin(2*np.pi*t) s2 = np.sin(4*np.pi*t

  • matplotlib之pyplot模块坐标轴标签设置使用(xlabel()、ylabel())

    在pyplot模块中可以使用xlabel()和ylabel()函数设置x轴y轴的标签.这两个函数的使用方法非常相似. 使用xlabel()设置x轴标签 函数签名为matplotlib.pyplot.xlabel(xlabel, fontdict=None, labelpad=None, *, loc=None, **kwargs) 参数作用及取值如下: xlabel:类型为字符串,即标签的文本. labelpad:类型为浮点数,默认值为None,即标签与坐标轴的距离. loc:取值范围为{'le

  • matplotlib之pyplot模块坐标轴范围设置(autoscale(),xlim(),ylim())

    matplotlib默认根据数据系列自动缩放坐标轴范围.pyplot模块中的autoscale函数可以切换是否自动缩放坐标轴范围,xlim()和ylim()函数可手动设置坐标轴范围. autoscale函数 对于pyplot模块控制坐标轴范围是否自动缩放的函数为autoscale. 函数签名为matplotlib.pyplot.autoscale(enable=True, axis='both', tight=None) 参数作用及取值如下: enable为布尔值,即是否自动缩放. axis取值

  • matplotlib之Pyplot模块绘制三维散点图使用颜色表示数值大小

    目录 一.摘要 二.代码 三.部分代码解释 1. colormap(颜色)映射设置. 2. 设置三维散点格式 3. 设置侧边colorbar 四.参考 总结 一.摘要 在进行数据可视化时,对于一元函数f(x)=y数据我们可以使用二维平面图显示,x轴表示自变量,y轴表示函数值:对于二元函数f(x,y)=z数据我们也可以使用三维图可视化,x和y轴表示自变量,z轴表示函数值.由于显示设备的局限性,对于三元函数f(x,y,z)=v数据无法通过增加坐标轴的方式可视化,一个可行的方法是使用x.y和z轴表示自

  • 使用matplotlib的pyplot模块绘图的实现示例

    1. 绘制简单图形 使用 matplotlib 的pyplot模块绘制图形.看一个 绘制sin函数曲线的例子. import matplotlib.pyplot as plt import numpy as np # 生成数据 x = np.arange(0, 6, 0.1) # 以0.1为单位,生成0到 6 的数据* y = np.sin(x) # 绘制图形 plt.plot(x,y) plt.show() 这里使用NumPy的arange()方法生成了[0, 0.1, 0.2, - , 5.

  • 基于Matplotlib 调用 pyplot 模块中 figure() 函数处理 figure图形对象

    在 Matplotlib 中,面向对象编程的核心思想是创建图形对象(figure object).通过图形对象来调用其它的方法和属性,这样有助于我们更好地处理多个画布.在这个过程中,pyplot 负责生成图形对象,并通过该对象来添加一个或多个 axes 对象(即绘图区域). Matplotlib 提供了matplotlib.figure图形类模块,它包含了创建图形对象的方法.通过调用 pyplot 模块中 figure() 函数来实例化 figure 对象. 如下所示: from matplot

  • Pandas Matplotlib保存图形时坐标轴标签太长导致显示不全问题的解决

    目录 前言 1. 问题描述 2. 问题原因 4. 解决方法 结束语 前言 本篇博客主要解决在使用pandas绘制图像并保存时,由于标签太长,导致坐标轴上的标签显示不全的问题.刚遇到问题时调整了一下图片大小,然鹅并没有卵用,于是乎就检索了一下问题,发现没有解决pandas的.查询无果后,查看了一下官方文档,顿悟,这不就是matplotlib嘛,换了一个关键字再查询,果然,就是.所以本篇同样适用于解决matplotlib绘制图像时出现的这个问题. # 部分代码 df_sparsity = disti

  • matplotlib之pyplot模块之标题(title()和suptitle())

    matplotlib 源码解析标题实现(窗口标题,标题,子图标题不同之间的差异)添加链接描述简单比较了matplotlib中的标题. 使用title()设置子图标题 title()可同时在子图中显示中间.左侧.右侧3个标题. 函数签名为matplotlib.pyplot.title(label, fontdict=None, loc=None, pad=None, *, y=None, **kwargs) 参数作用及取值如下: label:类型为字符串,即标题文本. fontdict:类型为字典

  • matplotlib之pyplot模块添加文本、注解(text和annotate)

    目录 概述 text函数概述 annotate函数概述 text函数和annotate函数的对比 总结 概述 text函数作用是根据x,y坐标向图像添加文本. annotate函数作用是根据x,y坐标向图像添加文本注解. 两者非常相似,但是又有一定差别. text函数概述 text函数的签名为:matplotlib.pyplot.text(x, y, s, fontdict=None, **kwargs) 参数说明如下: x,y:放置文本的坐标.浮点数.必备参数. s:文本.字符串.必备参数.

  • matplotlib之pyplot模块实现添加子图subplot的使用

    概述 subplot()函数向当前图像(figure)添加一个子图(Axes),并将该子图设为当前子图.或者将某子图设为当前子图. pyplot.subplot()其实是Figure.add_subplot()的一个封装. 函数的定义签名为:matplotlib.pyplot.subplot(*args, **kwargs) 函数的调用签名为: subplot(nrows, ncols, index, **kwargs) subplot(pos, **kwargs) subplot(**kwar

  • Python利用matplotlib.pyplot绘图时如何设置坐标轴刻度

    前言 matplotlib.pyplot是一些命令行风格函数的集合,使matplotlib以类似于MATLAB的方式工作.每个pyplot函数对一幅图片(figure)做一些改动:比如创建新图片,在图片创建一个新的作图区域(plotting area),在一个作图区域内画直线,给图添加标签(label)等.matplotlib.pyplot是有状态的,亦即它会保存当前图片和作图区域的状态,新的作图函数会作用在当前图片的状态基础之上. 在开始本文之前,不熟悉的朋友可以先看看这篇文章:Python

随机推荐