Prometheus监控Springboot程序的实现方法
1. 添加依赖
我本次使用的Springboot版本为1.5.12.RELEASE,如果是Springboot2.0+,那么监控的配置以及吐出的监控指标会有所不同。
添加maven依赖,pom文件配置如下:
<dependency>
   <groupId>io.prometheus</groupId>
   <artifactId>simpleclient_spring_boot</artifactId>
   <version>${prometheus.client.version}</version>
  </dependency>
  <dependency>
   <groupId>io.prometheus</groupId>
   <artifactId>simpleclient</artifactId>
   <version>${prometheus.client.version}</version>
  </dependency>
  <dependency>
   <groupId>io.prometheus</groupId>
   <artifactId>simpleclient_hotspot</artifactId>
   <version>${prometheus.client.version}</version>
  </dependency>
其中Prometheus的版本号为:
<prometheus.client.version>0.5.0</prometheus.client.version>
2. 修改配置文件
修改application.properties配置文件,添加如下内容:
server.port=8080

# 启用基础认证
security.basic.enabled = false

# 安全路径列表,逗号分隔,此处只针对/admin路径进行认证
security.basic.path = /admin

# 认证使用的用户名
security.user.name = admin

# 认证使用的密码。 默认情况下,启动时会记录随机密码。
security.user.password = 123456

# 可以访问管理端点的用户角色列表,逗号分隔
management.security.roles = SUPERUSER

# actuator暴露接口使用的端口,为了和api接口使用的端口进行分离
management.port = 8099

# actuator暴露接口的前缀
management.context-path = /admin

# actuator是否需要安全保证
management.security.enabled = false

# actuator的metrics接口是否需要安全保证
endpoints.metrics.sensitive = false

# actuator的metrics接口是否开启
endpoints.metrics.enabled=true

# actuator的health接口是否需要安全保证
endpoints.health.sensitive=false

# actuator的health接口是否开启
endpoints.health.enabled=true
application.yml 配置如下:
# actuator是否需要安全保证
management.security.enabled: false
endpoints:
 metrics:
 # actuator的metrics接口是否需要安全保证
 sensitive: false
 # actuator的metrics接口是否开启
 enabled: true
 health:
 # actuator的health接口是否需要安全保证
 sensitive: false
 # actuator的health接口是否开启
 enabled: true
3. 启用Prometheus监控
在Springboot启动类上添加注解@EnablePrometheusEndpoint,同时使用simpleclient_hotspot中提供的DefaultExporter该Exporter会在metrics endpoint中放回当前应用JVM的相关信息
@SpringBootApplication
@EnablePrometheusEndpoint
@EnableSpringBootMetricsCollector
public class CaseApplication implements CommandLineRunner {

 public static void main(String[] args) {
  SpringApplication.run(CaseApplication.class, args);
 }

 @Override
 public void run(String... strings) throws Exception {
  DefaultExports.initialize();
 }

}
4. 监控埋点
4.1 新建拦截器
建立一个拦截器,用来拦截URL。
public class PrometheusMetricsInterceptor implements HandlerInterceptor {

 private Histogram.Timer histogramRequestTimer;
 private Histogram.Timer nacosTimer;
 private Histogram.Child nacosChild;

 static final Histogram requestLatencyHistogram = Histogram.build().labelNames("path", "method", "code")
   .name("io_namespace_http_requests_latency_seconds_histogram").help("Request latency in seconds.")
   .register();

 @Override
 public boolean preHandle(HttpServletRequest request, HttpServletResponse response, Object handler) throws Exception {
  System.out.println("-------Histogram--------");
  histogramRequestTimer = requestLatencyHistogram
    .labels(request.getRequestURI(), request.getMethod(), String.valueOf(response.getStatus()))
    .startTimer();
  nacosTimer = MetricsMonitor.getConfigRequestMonitor(request.getMethod(), request.getRequestURI(), String.valueOf(response.getStatus()));
  nacosChild = MetricsMonitor.getNamingRequestMonitor(request.getMethod(), request.getRequestURI(), String.valueOf(response.getStatus()));
  return true;
 }

 @Override
 public void postHandle(HttpServletRequest request, HttpServletResponse response, Object handler, ModelAndView modelAndView) throws Exception {

 }

 @Override
 public void afterCompletion(HttpServletRequest request, HttpServletResponse response, Object handler, Exception ex) throws Exception {
  histogramRequestTimer.observeDuration();
  nacosTimer.observeDuration();
  nacosChild.startTimer();
 }
}
4.2 注册拦截器
新建拦截器后需要注册到服务中才可以拦截URL。
@Configuration
public class WebServletContextConfiguration extends WebMvcConfigurationSupport {

 @Override
 public void addInterceptors(InterceptorRegistry registry) {

  registry.addInterceptor(getInterceptor()).addPathPatterns("/**");
  super.addInterceptors(registry);
 }

 @Bean
 public HandlerInterceptor getInterceptor() {
  return new PrometheusMetricsInterceptor();
 }

}
5. 验证监控
启动应用程序,访问地址
http://localhost:8099/admin/prometheus,验证是否存在监控指标。

6. 指标类型
普罗米修斯客户端库提供了四种核心度量类型。目前,它们只在客户端库(为了使api能够根据特定类型的使用而定制)和wire协议中有所区别。Prometheus服务器还没有利用类型信息,并将所有数据压缩成无类型的时间序列。这种情况在未来可能会改变。
6.1 Counter
计数器是一个累积度量,它表示一个单调递增的计数器,其值在重新启动时只能递增或重置为零。例如,您可以使用计数器来表示服务的请求、完成的任务或错误的数量。
不要使用计数器来暴露可能降低的值。例如,不要为当前正在运行的进程的数量使用计数器;而是使用量规。
示例代码:
import io.prometheus.client.Counter;
class YourClass {
 static final Counter requests = Counter.build()
  .name("requests_total").help("Total requests.").register();

 void processRequest() {
 requests.inc();
 // Your code here.
 }
}
6.2 Gauge
量规是一个度量单位,它表示一个可以任意上下移动的数值。
压力表通常用于测量温度或当前内存使用情况等测量值,但也用于“计数”,比如并发请求的数量。
示例代码:
class YourClass {
 static final Gauge inprogressRequests = Gauge.build()
  .name("inprogress_requests").help("Inprogress requests.").register();

 void processRequest() {
 inprogressRequests.inc();
 // Your code here.
 inprogressRequests.dec();
 }
}
6.3 Histogram
直方图对观察结果(通常是请求持续时间或响应大小之类的东西)进行采样,并在可配置的桶中计数。它还提供所有观测值的和。
示例代码:
class YourClass {
 static final Histogram requestLatency = Histogram.build()
  .name("requests_latency_seconds").help("Request latency in seconds.").register();

 void processRequest(Request req) {
 Histogram.Timer requestTimer = requestLatency.startTimer();
 try {
  // Your code here.
 } finally {
  requestTimer.observeDuration();
 }
 }
}
6.4 Summary
与柱状图类似,摘要对观察结果进行采样(通常是请求持续时间和响应大小之类的内容)。虽然它还提供了观察值的总数和所有观察值的总和,但它计算了一个滑动时间窗口上的可配置分位数。
class YourClass {
 static final Summary receivedBytes = Summary.build()
  .name("requests_size_bytes").help("Request size in bytes.").register();
 static final Summary requestLatency = Summary.build()
  .name("requests_latency_seconds").help("Request latency in seconds.").register();

 void processRequest(Request req) {
 Summary.Timer requestTimer = requestLatency.startTimer();
 try {
  // Your code here.
 } finally {
  receivedBytes.observe(req.size());
  requestTimer.observeDuration();
 }
 }
}
6.5 自定义Collector
有时不可能直接测试代码,因为它不在您的控制范围内。这要求您代理来自其他系统的指标。
为此,您需要创建一个自定义收集器(需要将其注册为普通度量)。
class YourCustomCollector extends Collector {
 List<MetricFamilySamples> collect() {
 List<MetricFamilySamples> mfs = new ArrayList<MetricFamilySamples>();
 // With no labels.
 mfs.add(new GaugeMetricFamily("my_gauge", "help", 42));
 // With labels
 GaugeMetricFamily labeledGauge = new GaugeMetricFamily("my_other_gauge", "help", Arrays.asList("labelname"));
 labeledGauge.addMetric(Arrays.asList("foo"), 4);
 labeledGauge.addMetric(Arrays.asList("bar"), 5);
 mfs.add(labeledGauge);
 return mfs;
 }
}

// Registration
static final YourCustomCollector requests = new YourCustomCollector().register()
7. 安装配置Prometheus
7.1 安装配置
下载安装包
wget https://github.com/prometheus/prometheus/releases/download/v2.12.0/prometheus-2.12.0.linux-amd64.tar.gz
解压文件
tar -zxvf prometheus-2.12.0.linux-amd64.tar.gz
修改配置文件prometheus.yml采集Nacos metrics数据。配置监控的job以及目标服务器,每一个目标服务器都是一个实例。
cd prometheus-*

后台启动Prometheus服务,并出到日志。
./prometheus --config.file=prometheus.yml > prometheus.log 2>&1 &
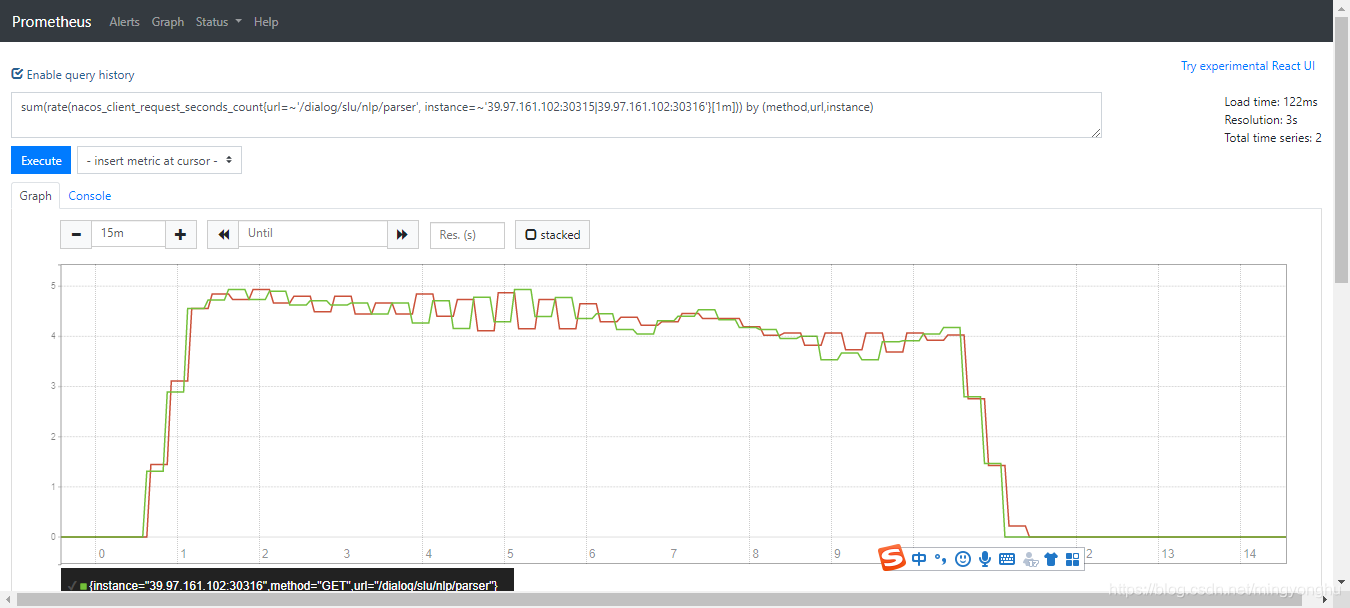
通过访问http://{ip}:9090/graph可以看到prometheus的采集数据,在搜索栏搜索监控指标,例如:nacos_monitor可以搜索到Nacos数据说明采集数据成功

在查询条件框中输入表达式,进行统计。例如:
sum(rate(nacos_client_request_seconds_count{url=~'/dialog/slu/nlp/parser', instance=~'39.97.161.102:30315|39.97.161.102:30316'}[1m])) by (method,url,instance)
结果如下图:
8. 安装配置Grafana
8.1 安装配置
安装grafana,下载安装包
wget https://dl.grafana.com/oss/release/grafana-6.5.2.linux-amd64.tar.gz
tar -zxvf grafana-6.5.2.linux-amd64.tar.gz
修改端口配置,复制一个配置文件,后续修改基于该自定义配置文件修改,不需要修改原始文件。
cd grafana-6.5.2/conf
cp sample.ini custom.ini
vi custom.ini
可以在该配置文件中修改端口号

访问grafana: http://{ip}:3000,用户名密码默认为:admin/admin。

登录时提示修改默认密码,如果不想修改可以跳过。
8.2 配置数据源


8.3 配置监控面板
监控面板可以自己配置,也可以通过导入json文件来进行修改,推荐使用配置好的json文件,修改起来会非常方便。


修改后的展示效果如图所示:

注:此处grafana的模板文件是从别处下载的,可以根据需要导入自己的模板文件。
9. 参考文献
到此这篇关于Prometheus监控Springboot程序的实现方法的文章就介绍到这了,更多相关Prometheus监控Springboot内容请搜索我们以前的文章或继续浏览下面的相关文章希望大家以后多多支持我们!
相关推荐
-

SpringBoot使用prometheus监控的示例代码
本文介绍SpringBoot如何使用Prometheus配合Grafana监控. 1.关于Prometheus Prometheus是一个根据应用的metrics来进行监控的开源工具.相信很多工程都在使用它来进行监控,有关详细介绍可以查看官网:https://prometheus.io/docs/introduction/overview/. 2.有关Grafana Grafana是一个开源监控利器,如图所示. 从图中就可以看出来,使用Grafana监控很高大上,提供了很多可视化的图标. 官网地
-
SpringBoot+Prometheus+Grafana实现应用监控和报警的详细步骤
背景 SpringBoot的应用监控方案比较多,SpringBoot+Prometheus+Grafana是目前比较常用的方案之一.它们三者之间的关系大概如下图: 开发SpringBoot应用 首先,创建一个SpringBoot项目,pom文件如下: <dependency> <groupId>org.springframework.boot</groupId> <artifactId>spring-boot-starter-actuator</art
-
springboot2.X整合prometheus监控的实例讲解
springboot2.x暴露健康状况通过prometheus监控 加入依赖 <!--prometheus监控 https://prometheus.io/docs/introduction/overview/--> <dependency> <groupId>org.springframework.boot</groupId> <artifactId>spring-boot-starter-actuator</artifactId>
-
Prometheus 入门教程之SpringBoot 实现自定义指标监控
上篇文章我们已经可以在 Grafana 上看到对应的 SpringBoot 应用信息了,通过这些信息我们可以对 SpringBoot 应用有更全面的监控.但是如果我们需要对一些业务指标做监控,我们应该怎么做呢?这篇文章就带你一步步实现一个模拟的订单业务指标监控. 假设我们有一个订单系统,我们需要监控它的实时订单总额.10 分钟内的下单失败率.请求失败数.那么我们应该怎么做呢? 添加业务监控指标 在 spring-web-prometheus-demo 项目的基础上,我们添加一个 Promethe
-
使用Prometheus+Grafana的方法监控Springboot应用教程详解
1 简介 项目越做越发觉得,任何一个系统上线,运维监控都太重要了.关于Springboot微服务的监控,之前写过[Springboot]用Springboot Admin监控你的微服务应用,这个方案可以实时监控并提供告警提醒功能,但不能记录历史数据,无法查看过去1小时或过去1天等运维情况.本文介绍Prometheus + Grafana的方法监控Springboot 2.X,实现美观漂亮的数据可视化. 2 Prometheus Prometheus是一套优秀的开源的监控.报警和时间序列数据库组合
-
prometheus监控springboot应用简单使用介绍详解
对于springboot应用,需要以下几个步骤 springboot应用开启endpoint,添加actuator的以来和promethus的依赖 <dependency> <groupId>org.springframework.boot</groupId> <artifactId>spring-boot-starter-actuator</artifactId> </dependency> <dependency> &
-
Prometheus监控Springboot程序的实现方法
1. 添加依赖 我本次使用的Springboot版本为1.5.12.RELEASE,如果是Springboot2.0+,那么监控的配置以及吐出的监控指标会有所不同. 添加maven依赖,pom文件配置如下: <dependency> <groupId>io.prometheus</groupId> <artifactId>simpleclient_spring_boot</artifactId> <version>${promethe
-
用SpringBoot Admin监控SpringBoot程序
项目源码地址:https://github.com/laolunsi/spring-boot-examples/tree/master/02-spring-boot-admin-demo 一.SpringBoot Admin概要 SpringBoot Admin用于监控SpringBoot程序,一个SpringBoot程序通过向SpringBoot Admin Server注册或使用@DiscoveryClient等微服务方式,可以将自身注册到SpringBoot Admin Server. S
-
Android编程实现监控各个程序流量的方法
本文实例讲述了Android编程实现监控各个程序流量的方法.分享给大家供大家参考,具体如下: public void getAppTrafficList(){ //获取所有的安装在手机上的应用软件的信息,并且获取这些软件里面的权限信息 PackageManager pm=getPackageManager();//获取系统应用包管理 //获取每个包内的androidmanifest.xml信息,它的权限等等 List<PackageInfo> pinfos=pm.getInstalledPac
-
prometheus监控节点程序的安装及卸载命令
目录 安装监控服务 卸载监控程序 本教程基于AlpineLinux,请注意将apk相关命令替换为对应系统的包命令,比如apt.yum等. 安装监控服务 apk add prometheus-node-exporter rc-update add node-exporter default # 配置节点 ARGS="--collector.processes --web.listen-address=:2910 --web.config=/etc/prometheus/web-config.yml
-
使用Python编写Prometheus监控的方法
要使用python编写Prometheus监控,需要你先开启Prometheus集群.可以参考//www.jb51.net/article/148895.htm 安装.在python中实现服务器端.在Prometheus中配置请求网址,Prometheus会定期向该网址发起申请获取你想要返回的数据. 使用Python和Flask编写Prometheus监控 Installation pip install flask pip install prometheus_client Metrics P
-
SpringBoot程序预装载数据的实现方法及实践
目录 简介 适用场景 ApplicationEvent 定义event 定义listener 注册event CommandLineRunner ApplicationRunner 测试 执行顺序 代码 简介 在项目实际的开发过程中,有时候会遇到需要在应用程序启动完毕对外提供服务之前预先将部分数据装载到缓存的需求.本文就总结了常见的数据预装载方式及其实践. 适用场景 预装载应用级别数据到缓存:如字典数据.公共的业务数据 系统预热 心跳检测:如在系统启动完毕访问一个外服务接口等场景 常用方法 Ap
-
使用Grafana+Prometheus监控mysql服务性能
Prometheus(也叫普罗米修斯)官网:https://prometheus.io/docs/introduction/overview/ Grafana官网:https://grafana.com/enterprise 特征 普罗米修斯的主要特点是: 具有由度量名称和键/值对标识的时间序列数据的多维数据模型 一个灵活的查询语言 来利用这一维度 不依赖分布式存储; 单个服务器节点是自治的 时间序列集合通过HTTP上的拉模型发生 推送时间序列通过中间网关支持 通过服务发现或静态配置发现目标 多