Python中使用kitti数据集实现自动驾驶(绘制出所有物体的行驶轨迹)
目录
- 1、利用IMU、GPS计算汽车移动距离和旋转角度
- 2、画出kitti车的行驶轨迹
- 3、画出所有车辆的轨迹
本次内容主要是上周内容的延续,主要画出kitti车的行驶的轨迹
同样的,我们先来看看最终实现的效果:
接下来就进入一步步的编码环节。。。
1、利用IMU、GPS计算汽车移动距离和旋转角度
- 计算移动距离
通过GPS计算
#定义计算GPS距离方法
def computer_great_circle_distance(lat1,lon1,lat2,lon2):
    delta_sigma = float(np.sin(lat1*np.pi/180)*np.sin(lat2*np.pi/180)+\
                        np.cos(lat1*np.pi/180)*np.cos(lat2*np.pi/180)*np.cos(lon1*np.pi/180-lon2*np.pi/180))
    return 6371000.0*np.arccos(np.clip(delta_sigma,-1,1))

#使用GPS计算距离
 gps_distance += [computer_great_circle_distance(imu_data.lat,imu_data.lon,prev_imu_data.lat,prev_imu_data.lon)]
通过IMU计算
IMU_COLUMN_NAMES = ['lat','lon','alt','roll','pitch','yaw','vn','ve','vf','vl','vu','ax','ay','az','af',
                    'al','au','wx','wy','wz','wf','wl','wu','posacc','velacc','navstat','numsats','posmode',
                    'velmode','orimode']
#获取IMU数据
imu_data = read_imu('/home/wsj/data/kitty/RawData/2011_09_26/2011_09_26_drive_0005_sync/oxts/data/%010d.txt'%frame)
#使用IMU计算距离
imu_distance += [0.1*np.linalg.norm(imu_data[['vf','vl']])]
比较两种方式计算出的距离(GPS/IMU)
import matplotlib.pyplot as plt
plt.figure(figsize=(20,10))
plt.plot(gps_distance, label='gps_distance')
plt.plot(imu_distance, label='imu_distance')
plt.legend()
plt.show()
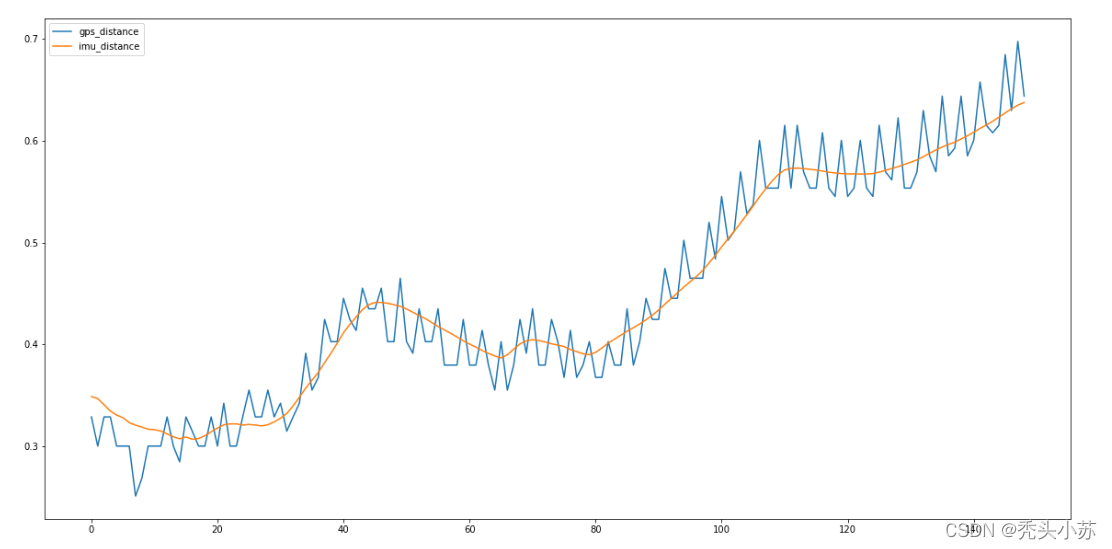
显然,IMU计算的距离较为平滑。
计算旋转角度 旋转角度的计算较为简单,我们只需要根据IMU获取到的yaw值就可以计算(前后两帧图像的yaw值相减)

2、画出kitti车的行驶轨迹
prev_imu_data = None
locations = []
for frame in range(150):
    imu_data = read_imu('/home/wsj/data/kitty/RawData/2011_09_26/2011_09_26_drive_0005_sync/oxts/data/%010d.txt'%frame)

    if prev_imu_data is not None:
        displacement = 0.1*np.linalg.norm(imu_data[['vf','vl']])
        yaw_change = float(imu_data.yaw-prev_imu_data.yaw)
        for i in range(len(locations)):
            x0, y0 = locations[i]
            x1 = x0 * np.cos(yaw_change) + y0 * np.sin(yaw_change) - displacement
            y1 = -x0 * np.sin(yaw_change) + y0 * np.cos(yaw_change)
            locations[i] = np.array([x1,y1])

    locations += [np.array([0,0])]
    prev_imu_data =imu_data
plt.figure(figsize=(20,10))
plt.plot(np.array(locations)[:, 0],np.array(locations)[:, 1])

3、画出所有车辆的轨迹
class Object():
    def __init__(self, center):
        self.locations = deque(maxlen=20)
        self.locations.appendleft(center)
    def update(self, center, displacement, yaw):
        for i in range(len(self.locations)):
            x0, y0 = self.locations[i]
            x1 = x0 * np.cos(yaw_change) + y0 * np.sin(yaw_change) - displacement
            y1 = -x0 * np.sin(yaw_change) + y0 * np.cos(yaw_change)
            self.locations[i] = np.array([x1,y1])
        if center is not None:
            self.locations.appendleft(center)
    def reset(self):
        self.locations = deque(maxlen=20)
#创建发布者
loc_pub = rospy.Publisher('kitti_loc', MarkerArray, queue_size=10)

  #获取距离和旋转角度
        imu_data =  read_imu('/home/wsj/data/kitty/RawData/2011_09_26/2011_09_26_drive_0005_sync/oxts/data/%010d.txt'%frame)

        if prev_imu_data is None:
            for track_id in centers:
                tracker[track_id] = Object(centers[track_id])
        else:
            displacement = 0.1*np.linalg.norm(imu_data[['vf','vl']])
            yaw_change = float(imu_data.yaw - prev_imu_data.yaw)
            for track_id in centers: # for one frame id
                if track_id in tracker:
                    tracker[track_id].update(centers[track_id], displacement, yaw_change)
                else:
                    tracker[track_id] = Object(centers[track_id])
            for track_id in tracker:# for whole ids tracked by prev frame,but current frame did not
                if track_id not in centers: # dont know its center pos
                    tracker[track_id].update(None, displacement, yaw_change)

        prev_imu_data = imu_data

def publish_loc(loc_pub, tracker, centers):
    marker_array = MarkerArray()
    for track_id in centers:
        marker = Marker()
        marker.header.frame_id = FRAME_ID
        marker.header.stamp = rospy.Time.now()

        marker.action = marker.ADD
        marker.lifetime = rospy.Duration(LIFETIME)
        marker.type = Marker.LINE_STRIP
        marker.id = track_id
        marker.color.r = 1.0
        marker.color.g = 1.0
        marker.color.b = 0.0
        marker.color.a = 1.0
        marker.scale.x = 0.2

        marker.points = []
        for p in tracker[track_id].locations:
            marker.points.append(Point(p[0], p[1], 0))
        marker_array.markers.append(marker)
    loc_pub.publish(marker_array)

到此这篇关于Python中使用kitti数据集实现自动驾驶——绘制出所有物体的行驶轨迹的文章就介绍到这了,更多相关kitti数据集自动驾驶内容请搜索我们以前的文章或继续浏览下面的相关文章希望大家以后多多支持我们!
相关推荐
-
Python之——生成动态路由轨迹图的实例
一.scapy简介与安装 scapy(http://www.secdev.org/projects/scapy/)是一个强大的交互式数据包处理程序,它能够对数据包进行伪造或解包,包括发送数据包.包嗅探.应答和反馈匹配等功能.可以用在处理网络扫描.路由跟踪.服务探测.单元测试等方面,本节主要针对scapy的路由跟踪功能,实现TCP协议方式对服务可用性的探测,比如常用的80(HTTP)与443(HTTPS)服务,并生成美观的路由线路图报表,让管理员清晰了解探测点到目标主机的服务状态.骨干路由节点所处
-

python 基于空间相似度的K-means轨迹聚类的实现
这里分享一些轨迹聚类的基本方法,涉及轨迹距离的定义.kmeans聚类应用. 需要使用的python库如下 import pandas as pd import numpy as np import random import os import matplotlib.pyplot as plt import seaborn as sns from scipy.spatial.distance import cdist from itertools import combinations from
-
python绘制铅球的运行轨迹代码分享
我们按照面向过程程序设计的思想,使用python编写了程序,追踪铅球在运行过程中的位置信息.下面,修改程序代码,导入turtle模块,将铅球的运行轨迹绘制出来. python3代码如下: from math import pi, sin, cos, radians from turtle import Turtle def main(): angle = eval(input('Enter the launch angle(in degrees):')) vel = eval(input('En
-
python 自动轨迹绘制的实例代码
用到的思维: 自动化思维,数据和功能分开处理,用数据驱动程序自动运行 接口化设计,数据与程序的对接方式要清晰明了 二维数据应用,应用维度组织数据,二维数据最常用 代码 # AutoTrace.py import turtle as t t.title("自动轨迹绘制") t.setup(800,600) t.pencolor("red") t.pensize(5) t.speed(10) # 数据读取 datals=[] f=open("data.trac
-
Python中使用kitti数据集实现自动驾驶(绘制出所有物体的行驶轨迹)
目录 1.利用IMU.GPS计算汽车移动距离和旋转角度 2.画出kitti车的行驶轨迹 3.画出所有车辆的轨迹 本次内容主要是上周内容的延续,主要画出kitti车的行驶的轨迹 同样的,我们先来看看最终实现的效果: 视频 接下来就进入一步步的编码环节... 1.利用IMU.GPS计算汽车移动距离和旋转角度 计算移动距离 通过GPS计算 #定义计算GPS距离方法 def computer_great_circle_distance(lat1,lon1,lat2,lon2): delta_sigm
-
详解Python中4种超参自动优化算法的实现
目录 一.网格搜索(Grid Search) 二.随机搜索(Randomized Search) 三.贝叶斯优化(Bayesian Optimization) 四.Hyperband 总结 大家好,要想模型效果好,每个算法工程师都应该了解的流行超参数调优技术. 今天我给大家总结超参自动优化方法:网格搜索.随机搜索.贝叶斯优化 和 Hyperband,并附有相关的样例代码供大家学习. 一.网格搜索(Grid Search) 网格搜索是暴力搜索,在给定超参搜索空间内,尝试所有超参组合,最后搜索出最优
-
python中关于CIFAR10数据集的使用
目录 关于CIFAR10数据集的使用 CIFAR10的官方解释 实战操作 CIFAR-10 数据集简介 数据集版本 数据集布置 总结 关于CIFAR10数据集的使用 主要解决了如何把数据集与transforms结合在一起的问题. CIFAR10的官方解释 torchvision.datasets.CIFAR10( root: str, train: bool = True, transform: Optional[Callable] = None, target_transform: Opt
-
Python实现自动驾驶训练模型
目录 一.安装环境 二.配置环境 三.训练模型 1.数据处理 2.搭建模型 3.运行结果 四.总结 一.安装环境 gym是用于开发和比较强化学习算法的工具包,在python中安装gym库和其中子场景都较为简便. 安装gym: pip install gym 安装自动驾驶模块,这里使用Edouard Leurent发布在github上的包highway-env: pip install --user git+https://github.com/eleurent/highway-env 其中包含6
-
python中利用zfill方法自动给数字前面补0
python中有一个zfill方法用来给字符串前面补0,非常有用 view sourceprint? n = "123" s = n.zfill(5) assert s == "00123" zfill()也可以给负数补0 n = "-123" s = n.zfill(5) assert s == "-0123" 对于纯数字,我们也可以通过格式化的方式来补0 n = 123 s = "%05d" % n a
-
解决Python中定时任务线程无法自动退出的问题
python的线程有一个类叫Timer可以,用来创建定时任务,但是它的问题是只能运行一次,如果要重复执行,则只能在任务中再调用一次timer,但这样就存在新的问题了,就是在主进程退出后,不能正常退出子线程. from threading import Timer def scheduletaskwrap(): pritn "in task" Timer(10, scheduletaskwrap).start() Timer(10, scheduletaskwrap).start() 象
-
对python中数据集划分函数StratifiedShuffleSplit的使用详解
文章开始先讲下交叉验证,这个概念同样适用于这个划分函数 1.交叉验证(Cross-validation) 交叉验证是指在给定的建模样本中,拿出其中的大部分样本进行模型训练,生成模型,留小部分样本用刚建立的模型进行预测,并求这小部分样本的预测误差,记录它们的平方加和.这个过程一直进行,直到所有的样本都被预测了一次而且仅被预测一次,比较每组的预测误差,选取误差最小的那一组作为训练模型. 下图所示 2.StratifiedShuffleSplit函数的使用 官方文档 用法: from sklearn.
-
解决python中无法自动补全代码的问题
自已理解自我总结出来的方法,供自己以后使用 #coding:utf-8 from cv2 import * #这里表示让cv2的智能提示功能可用,但是这句话却没有导入cv2模块,不知道什么原因 import tensorflow as tf import tensorflow.contrib as contrib #这句话表示让contrib的代码自动补全功能可用,不知道为啥,比如输入contrib.等一会后面就会自动提示出现很多方法,但是输入tensorflow.contrib.却没有任何反应
-
python中matplotlib实现随鼠标滑动自动标注代码
Python+matplotlib进行鼠标交互,实现动态标注,数据可视化显示,鼠标划过时画一条竖线并使用标签来显示当前值. Python3.6.5,代码示例: import matplotlib.pyplot as plt import numpy as np def Show(y): #参数为一个list len_y = len(y) x = range(len_y) _y = [y[-1]]*len_y fig = plt.figure(figsize=(960/72,360/72)) ax
-
python中如何设置代码自动提示
第一步:打开pycharm,如下图所示: 第二步:File→Power Save Mode,把下面如图所示的勾去掉: 第三步:去掉勾后,不再使用省电模式,新建一个 python文件,输入需要输入的单词的前面的字母,就会自动提示了.如下图: 知识点扩展: Python代码的自动补全 我所知道的python编辑器有Pydev.Pycharm.Sublime.Eric.还有就是Vim.Emacs(听说VS也行). Pydev用过一段时间(半个月左右).Pycharm用的时间不超过2天(30天试用版).