Python实现的matplotlib动画演示之细胞自动机
目录
- ArtistAnimation动画
- FuncAnimation动画
- 随机生命游戏
维基百科上有个有意思的话题叫细胞自动机:https://en.wikipedia.org/wiki/Cellular_automaton
在20世纪70年代,一种名为生命游戏的二维细胞自动机变得广为人知,特别是在早期的计算机界。由约翰 · 康威发明,马丁 · 加德纳在《科学美国人》的一篇文章中推广,其规则如下:
- Any live cell with fewer than two live neighbours dies, as if caused by underpopulation.
- Any live cell with two or three live neighbours lives on to the next generation.
- Any live cell with more than three live neighbours dies, as if by overpopulation.
- Any dead cell with exactly three live neighbours becomes a live cell, as if by reproduction.
总结就是:任何活细胞在有两到三个活邻居时能活到下一代,否则死亡。任何有三个活邻居的死细胞会变成活细胞,表示繁殖。
在Conway’s Game of Life中,展示了几种初始状态:
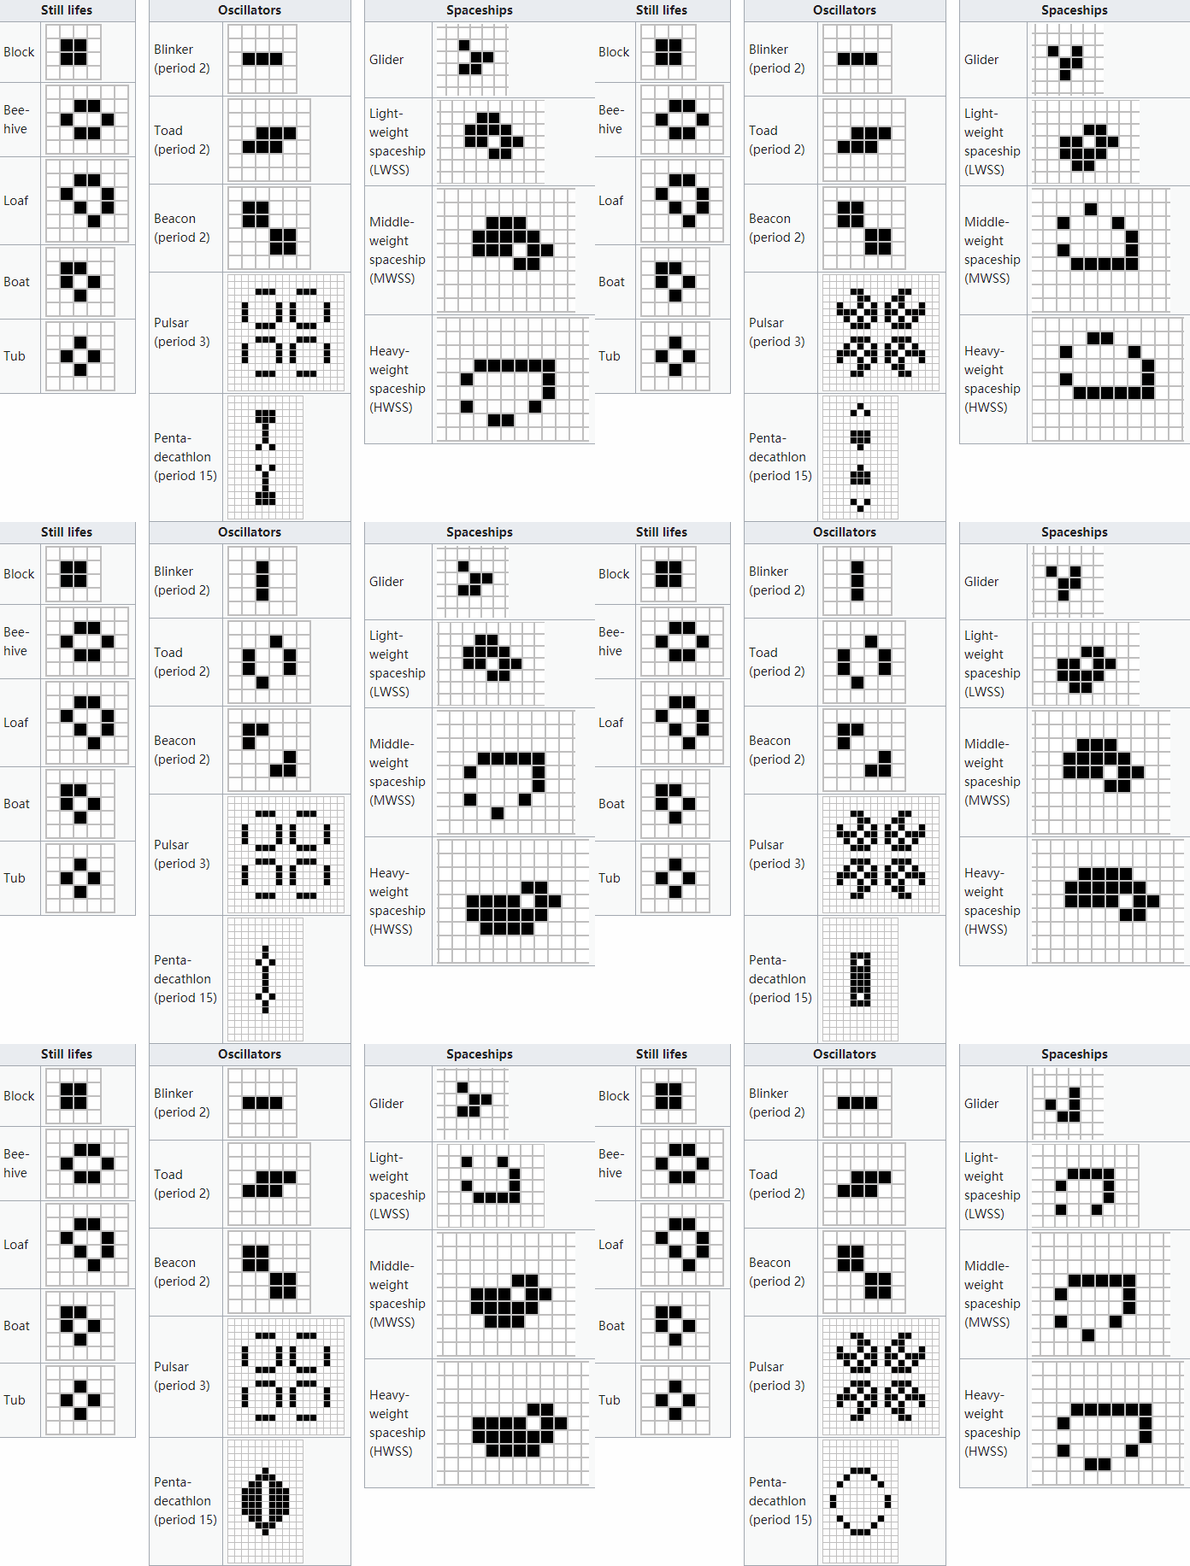
下面我们用python来模拟,首先尝试表示Beacon:
import numpy as np
import matplotlib.pyplot as plt
universe = np.zeros((6, 6), "byte")
# Beacon
universe[1:3, 1:3] = 1
universe[3:5, 3:5] = 1
print(universe)
im = plt.imshow(universe, cmap="binary")
[[0 0 0 0 0 0]
 [0 1 1 0 0 0]
 [0 1 1 0 0 0]
 [0 0 0 1 1 0]
 [0 0 0 1 1 0]
 [0 0 0 0 0 0]]
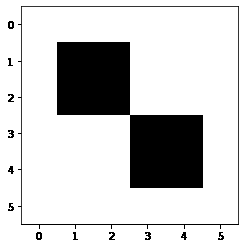
可以看到已经成功的打印出了Beacon的形状,下面我们继续编写细胞自动机的演化规则:
def cellular_auto(universe):
    universe_new = universe.copy()
    h, w = universe.shape
    for y in range(h):
        for x in range(w):
            neighbor_num = universe[x-1:x+2, y-1:y+2].sum()-universe[x, y]
            # 任何有三个活邻居的死细胞都变成了活细胞,繁殖一样。
            if universe[x, y] == 0 and neighbor_num == 3:
                universe_new[x, y] = 1
            # 任何有两到三个活邻居的活细胞都能活到下一代,否则就会死亡。
            if universe[x, y] == 1 and neighbor_num not in (2, 3):
                universe_new[x, y] = 0
    return universe_new
universe = cellular_auto(universe)
print(universe)
plt.axis("off")
im = plt.imshow(universe, cmap="binary")
[[0 0 0 0 0 0]
 [0 1 1 0 0 0]
 [0 1 0 0 0 0]
 [0 0 0 0 1 0]
 [0 0 0 1 1 0]
 [0 0 0 0 0 0]]

ArtistAnimation动画
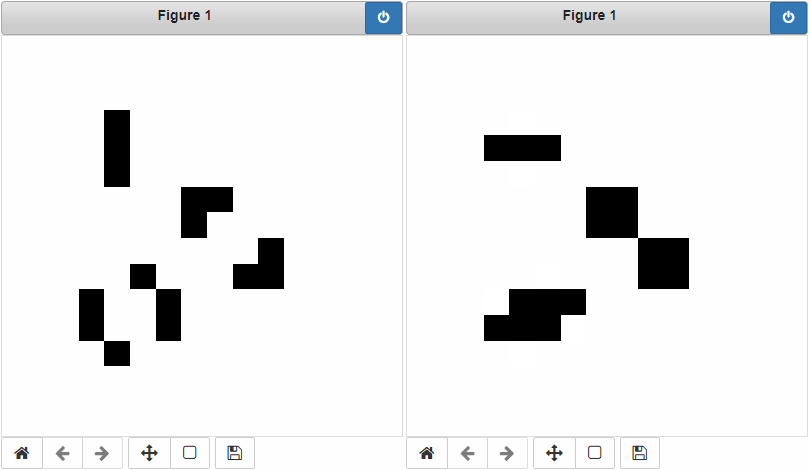
基于此我们可以制作matplotlib的动画,下面直接将Blinker、Toad、Beacon都放上去:
from matplotlib import animation
import numpy as np
import matplotlib.pyplot as plt
%matplotlib notebook

def cellular_auto(universe):
    universe_new = universe.copy()
    h, w = universe.shape
    for y in range(h):
        for x in range(w):
            neighbor_num = universe[x-1:x+2, y-1:y+2].sum()-universe[x, y]
            # 任何有三个活邻居的死细胞都变成了活细胞,繁殖一样。
            if universe[x, y] == 0 and neighbor_num == 3:
                universe_new[x, y] = 1
            # 任何有两到三个活邻居的活细胞都能活到下一代,否则就会死亡。
            if universe[x, y] == 1 and neighbor_num not in (2, 3):
                universe_new[x, y] = 0
    return universe_new
universe = np.zeros((12, 12), "byte")
# Blinker
universe[2, 1:4] = 1
# Beacon
universe[4:6, 5:7] = 1
universe[6:8, 7:9] = 1
# Toad
universe[8, 2:5] = 1
universe[9, 1:4] = 1
fig = plt.figure()
plt.axis("off")
im = plt.imshow(universe, cmap="binary")
frame = []
for _ in range(2):
    frame.append((plt.imshow(universe, cmap="binary"),))
    universe = cellular_auto(universe)
animation.ArtistAnimation(fig, frame, interval=500, blit=True)
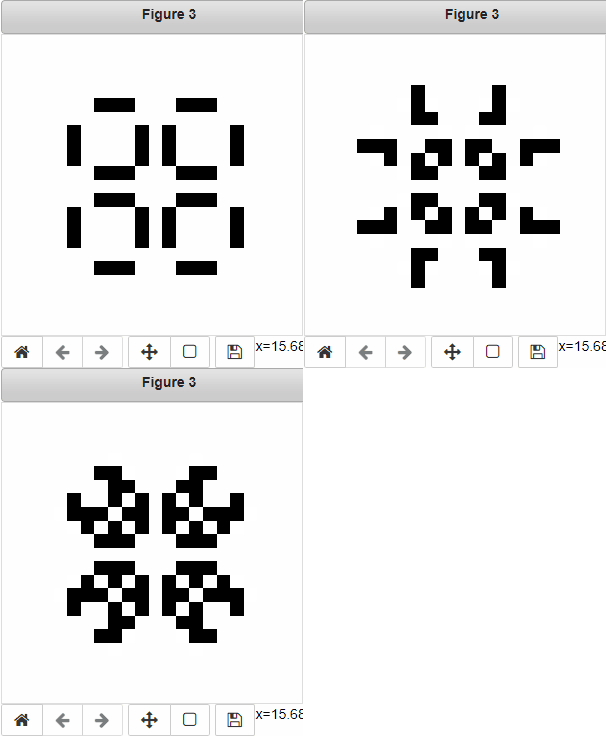
然后我们画一下Pulsar:
# Pulsar
universe = np.zeros((17, 17), "byte")
universe[[2, 7, 9, 14], 4:7] = 1
universe[[2, 7, 9, 14], 10:13] = 1
universe[4:7, [2, 7, 9, 14]] = 1
universe[10:13, [2, 7, 9, 14]] = 1
fig = plt.figure()
plt.axis("off")
im = plt.imshow(universe, cmap="binary")
frame = []
for _ in range(3):
    frame.append((plt.imshow(universe, cmap="binary"),))
    universe = cellular_auto(universe)
animation.ArtistAnimation(fig, frame, interval=500, blit=True)
FuncAnimation动画
另一种创建matplotlib动画的方法是使用FuncAnimation,完整代码:
from matplotlib import animation
import numpy as np
import matplotlib.pyplot as plt
from IPython.display import HTML
# %matplotlib notebook

def cellular_auto(universe):
    universe_new = universe.copy()
    h, w = universe.shape
    for y in range(h):
        for x in range(w):
            neighbor_num = universe[x-1:x+2, y-1:y+2].sum()-universe[x, y]
            # 任何有三个活邻居的死细胞都变成了活细胞,繁殖一样。
            if universe[x, y] == 0 and neighbor_num == 3:
                universe_new[x, y] = 1
            # 任何有两到三个活邻居的活细胞都能活到下一代,否则就会死亡。
            if universe[x, y] == 1 and neighbor_num not in (2, 3):
                universe_new[x, y] = 0
    return universe_new
def update(i=0):
    global universe
    im.set_data(universe)
    universe = cellular_auto(universe)
    return im,
# Pulsar
universe = np.zeros((17, 17), "byte")
universe[[2, 7, 9, 14], 4:7] = 1
universe[[2, 7, 9, 14], 10:13] = 1
universe[4:7, [2, 7, 9, 14]] = 1
universe[10:13, [2, 7, 9, 14]] = 1
fig = plt.figure()
plt.axis("off")
im = plt.imshow(universe, cmap="binary")
plt.show()
anim = animation.FuncAnimation(
    fig, update, frames=3, interval=500, blit=True)
HTML(anim.to_jshtml())
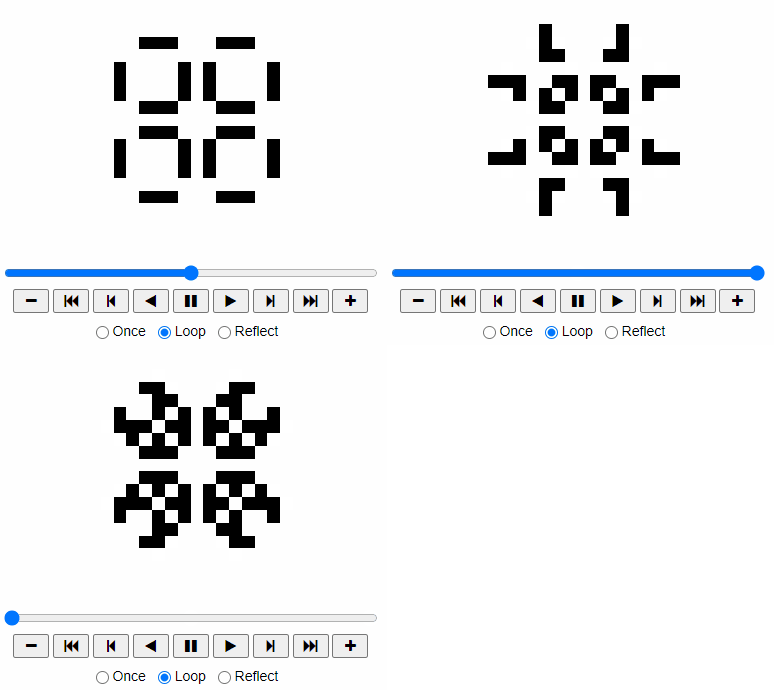
这种动画生成速度较慢,好处是可以导出html文件:
with open("out.html", "w") as f:
    f.write(anim.to_jshtml())
还可以保存MP4视频:
anim.save("out.mp4")
或gif动画:
anim.save("out.gif")
注意:保存MP4视频或GIF动画,需要事先将ffmpeg配置到环境变量中
ffmpeg下载地址:
链接: https://pan.baidu.com/s/1aioB_BwpKb6LxJs26HbbiQ?pwd=ciui
提取码: ciui
随机生命游戏
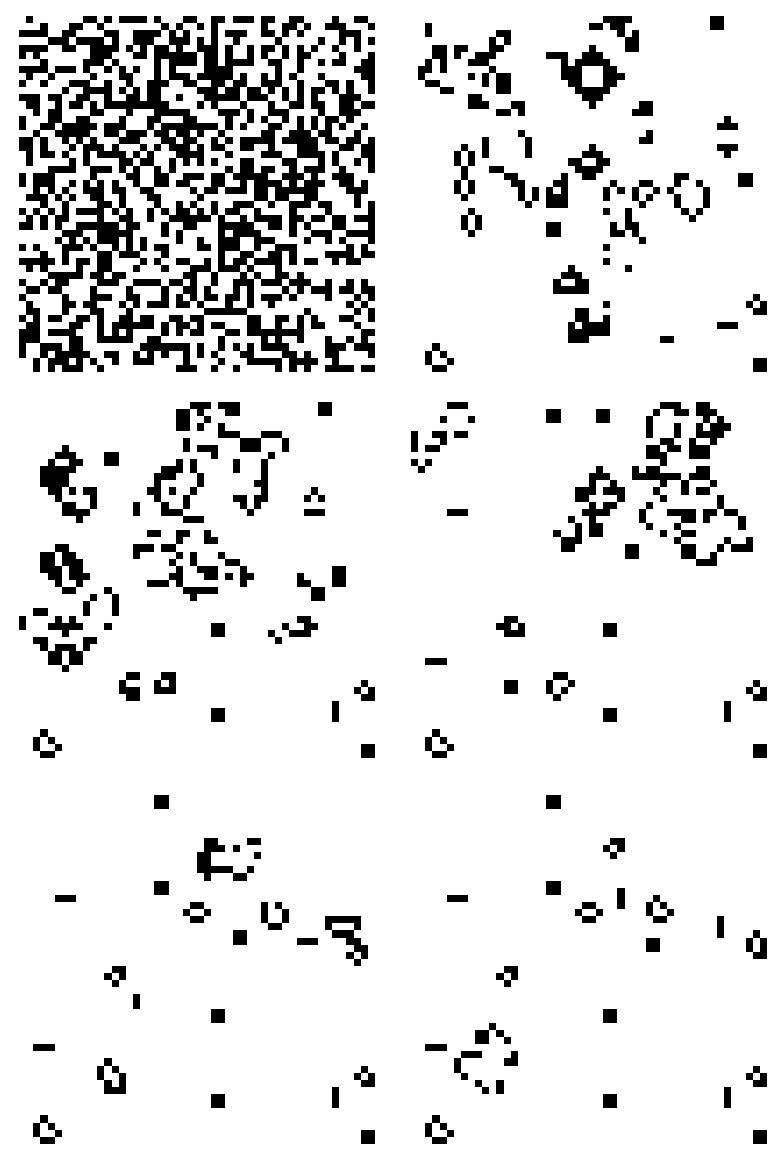
接下来,我们创建一个50*50的二维生命棋盘,并选取其中1500个位置作为初始活细胞点,我们看看最终生成的动画如何。
完整代码如下:
from matplotlib import animation
import numpy as np
import matplotlib.pyplot as plt
%matplotlib notebook

def cellular_auto(universe):
    universe_new = universe.copy()
    h, w = universe.shape
    for y in range(1, h-1):
        for x in range(1, w-1):
            neighbor_num = universe[x-1:x+2, y-1:y+2].sum()-universe[x, y]
            # 任何有三个活邻居的死细胞都变成了活细胞,繁殖一样。
            if universe[x, y] == 0 and neighbor_num == 3:
                universe_new[x, y] = 1
            # 任何有两到三个活邻居的活细胞都能活到下一代,否则就会死亡。
            if universe[x, y] == 1 and neighbor_num not in (2, 3):
                universe_new[x, y] = 0
    # 边缘置零
    universe[[0, -1]] = 0
    universe[:, [0, -1]] = 0
    return universe_new
boardsize, pad = 50, 2
universe = np.zeros((boardsize+pad, boardsize+pad), "byte")
# 随机选取1500个点作为初始活细胞
for i in range(1500):
    x, y = np.random.randint(1, boardsize+1, 2)
    universe[y, x] = 1

fig = plt.figure()
plt.axis("off")
im = plt.imshow(universe, cmap="binary")
frame = []
for _ in range(200):
    frame.append((plt.imshow(universe, cmap="binary"),))
    universe = cellular_auto(universe)
animation.ArtistAnimation(fig, frame, interval=50, blit=True)
到此这篇关于Python实现的matplotlib动画演示之细胞自动机的文章就介绍到这了,更多相关python matplotlib动画内容请搜索我们以前的文章或继续浏览下面的相关文章希望大家以后多多支持我们!

