matplotlib绘制鼠标的十字光标的实现(内置方式)
相对于echarts等基于JavaScript的图表库,matplotlib的交互能力相对较差。
在实际应用中,我们经常想使用十字光标来定位数据坐标,matplotlib内置提供支持。
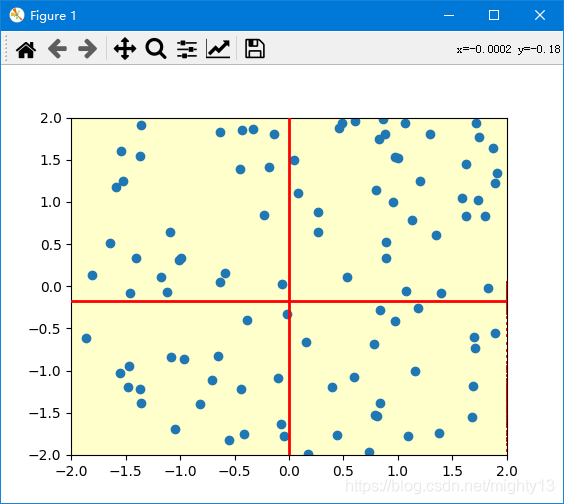
官方示例
matplotlib提供了官方示例https://matplotlib.org/gallery/widgets/cursor.html
from matplotlib.widgets import Cursor
import numpy as np
import matplotlib.pyplot as plt

# Fixing random state for reproducibility
np.random.seed(19680801)

fig = plt.figure(figsize=(8, 6))
ax = fig.add_subplot(111, facecolor='#FFFFCC')

x, y = 4*(np.random.rand(2, 100) - .5)
ax.plot(x, y, 'o')
ax.set_xlim(-2, 2)
ax.set_ylim(-2, 2)

# Set useblit=True on most backends for enhanced performance.
cursor = Cursor(ax, useblit=True, color='red', linewidth=2)

plt.show()

原理
由源码可知,实现十字光标的关键在于widgets模块中的Cursor类。
class matplotlib.widgets.Cursor(ax, horizOn=True, vertOn=True, useblit=False, **lineprops)
ax:参数类型matplotlib.axes.Axes,即需要添加十字光标的子图。horizOn:布尔值,是否显示十字光标中的横线,默认值为显示。vertOn:布尔值,是否显示十字光标中的竖线,默认值为显示。useblit:布尔值,是否使用优化模式,默认值为否,优化模式需要后端支持。**lineprops:十字光标线形属性, 参见axhline函数支持的属性,https://matplotlib.org/api/_as_gen/matplotlib.axes.Axes.axhline.html#matplotlib.axes.Axes.axhline。
简化案例
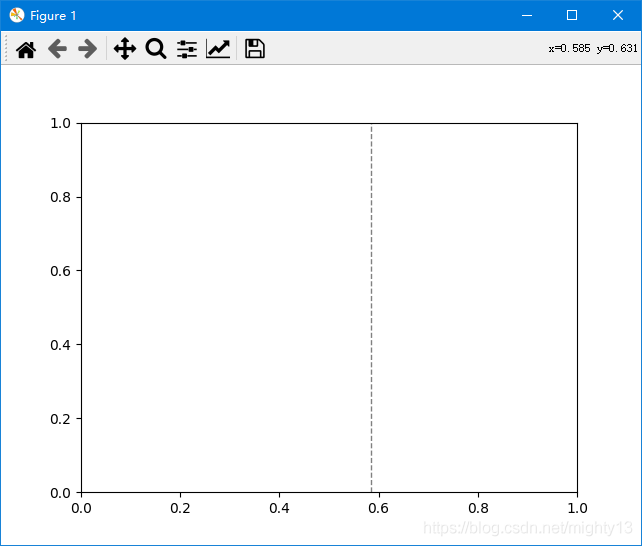
光标改为灰色竖虚线,线宽为1。
from matplotlib.widgets import Cursor
import matplotlib.pyplot as plt

ax = plt.gca()
cursor = Cursor(ax, horizOn=False, vertOn= True, useblit=False, color='grey', linewidth=1,linestyle='--')
plt.show()

## Cursor类源码
class Cursor(AxesWidget):
  """
  A crosshair cursor that spans the axes and moves with mouse cursor.

  For the cursor to remain responsive you must keep a reference to it.

  Parameters
  ----------
  ax : `matplotlib.axes.Axes`
    The `~.axes.Axes` to attach the cursor to.
  horizOn : bool, default: True
    Whether to draw the horizontal line.
  vertOn : bool, default: True
    Whether to draw the vertical line.
  useblit : bool, default: False
    Use blitting for faster drawing if supported by the backend.

  Other Parameters
  ----------------
  **lineprops
    `.Line2D` properties that control the appearance of the lines.
    See also `~.Axes.axhline`.

  Examples
  --------
  See :doc:`/gallery/widgets/cursor`.
  """

  def __init__(self, ax, horizOn=True, vertOn=True, useblit=False,
         **lineprops):
    AxesWidget.__init__(self, ax)

    self.connect_event('motion_notify_event', self.onmove)
    self.connect_event('draw_event', self.clear)

    self.visible = True
    self.horizOn = horizOn
    self.vertOn = vertOn
    self.useblit = useblit and self.canvas.supports_blit

    if self.useblit:
      lineprops['animated'] = True
    self.lineh = ax.axhline(ax.get_ybound()[0], visible=False, **lineprops)
    self.linev = ax.axvline(ax.get_xbound()[0], visible=False, **lineprops)

    self.background = None
    self.needclear = False

  def clear(self, event):
    """Internal event handler to clear the cursor."""
    if self.ignore(event):
      return
    if self.useblit:
      self.background = self.canvas.copy_from_bbox(self.ax.bbox)
    self.linev.set_visible(False)
    self.lineh.set_visible(False)

  def onmove(self, event):
    """Internal event handler to draw the cursor when the mouse moves."""
    if self.ignore(event):
      return
    if not self.canvas.widgetlock.available(self):
      return
    if event.inaxes != self.ax:
      self.linev.set_visible(False)
      self.lineh.set_visible(False)

      if self.needclear:
        self.canvas.draw()
        self.needclear = False
      return
    self.needclear = True
    if not self.visible:
      return
    self.linev.set_xdata((event.xdata, event.xdata))

    self.lineh.set_ydata((event.ydata, event.ydata))
    self.linev.set_visible(self.visible and self.vertOn)
    self.lineh.set_visible(self.visible and self.horizOn)

    self._update()

  def _update(self):
    if self.useblit:
      if self.background is not None:
        self.canvas.restore_region(self.background)
      self.ax.draw_artist(self.linev)
      self.ax.draw_artist(self.lineh)
      self.canvas.blit(self.ax.bbox)
    else:
      self.canvas.draw_idle()
    return False
到此这篇关于matplotlib绘制鼠标的十字光标的实现(内置方式)的文章就介绍到这了,更多相关matplotlib 十字光标内容请搜索我们以前的文章或继续浏览下面的相关文章希望大家以后多多支持我们!
赞 (0)

