Docker 部署 Prometheus的安装详细教程
目录
- 1.安装Node Exporter
- 2.安装cAdvisor
- 3.安装 Prometheus Server
- 4.创建运行Grafana
- 5.添加监控模板
- 6.键值查询
- 7.使用Prometheus监控
- 8.各个监控项的含义
- 9.Prometheus UI中Target表达式查询
- 10.安装blackbox_exporter
- 11.Docker部署nginx-module-vts模块
- Docker 搭建 Consul集群(未完)
Docker 部署 Prometheus 说明:
监控端安装:
Prometheus Server(普罗米修斯监控主服务器 )
Node Exporter (收集Host硬件和操作系统信息)
cAdvisor (负责收集Host上运行的容器信息)
Grafana (展示普罗米修斯监控界面)
被监控安装:
Node Exporter (收集Host硬件和操作系统信息)
cAdvisor (负责收集Host上运行的容器信息)
1.安装Node Exporter
- 所有服务器安装
- Node Exporter 收集系统信息,用于监控CPU、内存、磁盘使用率、磁盘读写等系统信息
- –net=host,这样 Prometheus Server 可以直接与 Node Exporter 通信
docker run -d -p 9100:9100 \
-v "/proc:/host/proc" \
-v "/sys:/host/sys" \
-v "/:/rootfs" \
-v "/etc/localtime:/etc/localtime" \
--net=host \
prom/node-exporter \
--path.procfs /host/proc \
--path.sysfs /host/sys \
--collector.filesystem.ignored-mount-points "^/(sys|proc|dev|host|etc)($|/)"

[root@k8s-m1 ~]# docker ps|grep exporter
ee30add8d207   prom/node-exporter                                  "/bin/node_exporter …"   About a minute ago   Up About a minute                 condescending_shirley
2.安装cAdvisor
- 所有服务器安装
- cAdvisor 收集docker信息,用于展示docker的cpu、内存、上传下载等信息
- –net=host,这样 Prometheus Server 可以直接与 cAdvisor 通信
docker run -d \
-v "/etc/localtime:/etc/localtime" \
--volume=/:/rootfs:ro \
--volume=/var/run:/var/run:rw \
--volume=/sys:/sys:ro \
--volume=/var/lib/docker/:/var/lib/docker:ro \
--volume=/dev/disk/:/dev/disk:ro \
--publish=18104:8080 \
--detach=true \
--name=cadvisor \
--privileged=true \
google/cadvisor:latest

[root@k8s-m1 ~]# docker ps|grep cadvisor
cf6af6118055        google/cadvisor:latest                            "/usr/bin/cadvisor -…"   38 seconds ago       Up 37 seconds       0.0.0.0:18104->8080/tcp   cadvisor
可以进入容器查看:
[root@agent ~]# sudo docker exec -it 容器id /bin/sh
3.安装 Prometheus Server
监控端安装
1)编辑配置文件
- 首先在本地创建 prometheus.yml 这是普罗米修斯的配置文件
- 将下方内容写入到文件中
- 将监听的地址改为自己本机地址
# my global config
global:
  scrape_interval:     15s # Set the scrape interval to every 15 seconds. Default is every 1 minute.
  evaluation_interval: 15s # Evaluate rules every 15 seconds. The default is every 1 minute.
  # scrape_timeout is set to the global default (10s).

# Alertmanager configuration
alerting:
  alertmanagers:
  - static_configs:
    - targets:
      # - alertmanager:9093

# Load rules once and periodically evaluate them according to the global 'evaluation_interval'.
rule_files:
  # - "first_rules.yml"
  # - "second_rules.yml"

# A scrape configuration containing exactly one endpoint to scrape:
# Here it's Prometheus itself.
scrape_configs:
  # The job name is added as a label `job=<job_name>` to any timeseries scraped from this config.
  - job_name: 'prometheus'

    # metrics_path defaults to '/metrics'
    # scheme defaults to 'http'.

    static_configs:
    #监听的地址
    - targets: ['localhost:9090','172.23.0.241:8088','172.23.0.241:9090']
2)启动容器
1> prometheus.yml配置文件
prometheus.yml内需配置外网ip,内网ip除了本机,在grafana识别不到!
# my global confi
global:
  scrape_interval:     15s # Set the scrape interval to every 15 seconds. Default is every 1 minute.
  evaluation_interval: 15s # Evaluate rules every 15 seconds. The default is every 1 minute.
  # scrape_timeout is set to the global default (10s).

# Alertmanager configuration
alerting:
  alertmanagers:
  - static_configs:
    - targets:
      # - alertmanager:9093

# Load rules once and periodically evaluate them according to the global 'evaluation_interval'.
rule_files:
  # - "first_rules.yml"
  # - "second_rules.yml"

# A scrape configuration containing exactly one endpoint to scrape:
# Here it's Prometheus itself.
scrape_configs:
  # The job name is added as a label `job=<job_name>` to any timeseries scraped from this config.
  - job_name: 'prometheus'

    # metrics_path defaults to '/metrics'
    # scheme defaults to 'http'.

    static_configs:
    #监听的地址(此处为服务器内网ip)
    - targets: ['10.27.158.33:9090','10.27.158.33:9100','10.27.158.33:18104']
    - targets: ['10.29.46.54:9100','10.29.46.54:18104']
    - targets: ['10.27.163.172:9100','10.27.163.172:18104']

#  - job_name: 'GitLab'
#    metrics_path: '/-/metrics'
#    static_configs:
#    - targets: ['172.23.0.241:10101']

  - job_name: 'jenkins'
    metrics_path: '/prometheus/'
    scheme: http
    bearer_token: bearer_token
    static_configs:
    - targets: ['172.23.0.242:8080']

  - job_name: "Nginx"
    metrics_path: '/status/format/prometheus'
    static_configs:
    - targets: ['172.23.0.242:8088']
2>启动命令
–net=host,这样 Prometheus Server 可以直接与 Exporter 和 Grafana 通
docker run -d -p 9090:9090 \
-v /root/Prometheus/prometheus.yml:/etc/prometheus/prometheus.yml \
-v "/etc/localtime:/etc/localtime" \
--name prometheus \
--net=host \
prom/prometheus:latest

# 当Prometheus容器启动成功后访问
# PS:服务器需开启eth0的外网端口,才可用浏览器访问 9090 0.0.0.0
106.15.0.11:9090
4.创建运行Grafana
- 监控服务器安装
- 用于图像化显示
docker run -d -i -p 3000:3000 \
-v "/etc/localtime:/etc/localtime" \
-e "GF_SERVER_ROOT_URL=http://grafana.server.name" \
-e "GF_SECURITY_ADMIN_PASSWORD=admin8888" \
--net=host \
grafana/grafana

# PS:服务器需开启eth0的外网端口,才可用浏览器访问:3000 0.0.0.0
Grafana启动后,在浏览器中打开 172.23.0.241:3000 登录界面,登录:
	用户名:admin
	密码:admin8888
1)添加普罗米修斯服务器


然后为添加好的数据源做图形显示
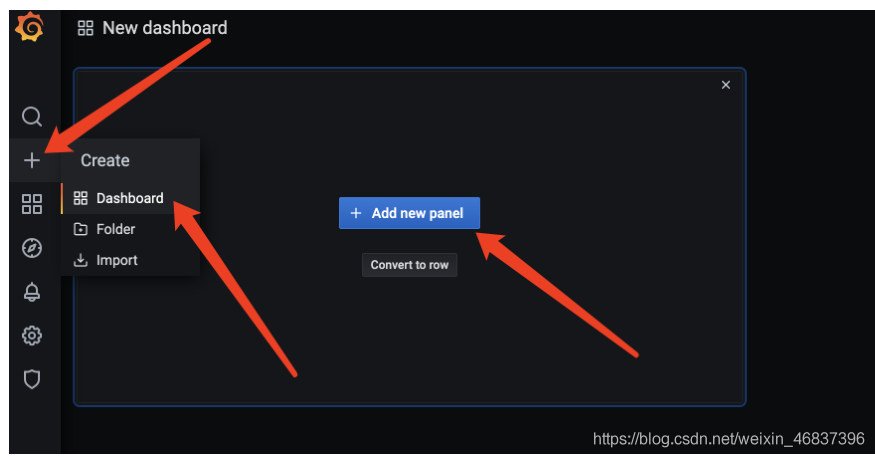


5.添加监控模板
- 自己手工创建dashboard有点困难,可以借助开元的力量访问 [监控模板地址]https://grafana.com/grafana/dashboards将会看到很多用于监控 Docker 的 Dashboard。监控模板地址(多种监控模板根据自己需求下载不同的模板)
- 监控模板地址
- 有些dashboard可以下载后直接导入,而有些需要修改后再导入,需要看dashboard的overview
- 最后效果

这时候可以自己选择编译对应的模板,在prometheus上取值
传到grafana上。就可以了。挺好用的!
6.键值查询
通过指标 io_namespace_http_requests_total 我们可以:
查询应用的请求总量
	sum(io_namespace_http_requests_total)
查询每秒Http请求量
	sum(rate(io_wise2c_gateway_requests_total[5m]))
查询当前应用请求量Top N的URI
	topk(10, sum(io_namespace_http_requests_total) by (path))
配置Prometheus监控Nginx
1、需给Nginx安装两个模块,才可用Prometheus来监控:nginx-module-vts、geoip
2、思路:原来无论是编译、还是yum装的nginx,都需要下载同版本的tar包,基于原来安装选项的基础上,增加以上两个模块选项,进行编译安装,来替换原来的nginx,最终将原nginx目录的配置文件如nginx.conf文件、conf.d目录再移动到编译安装后的nignx目录内,最后启动nginx即可。
这里官方源安装:
1)配置官方源
[root@web01 ~]# vim /etc/yum.repos.d/nginx.repo
[nginx-stable]
name=nginx stable repo
baseurl=http://nginx.org/packages/centos/7/$basearch/
gpgcheck=1
enabled=1
gpgkey=https://nginx.org/keys/nginx_signing.key
module_hotfixes=true
2)安装依赖
yum install -y gcc gcc-c++ autoconf pcre pcre-devel make automake wget httpd-tools vim tree
3)安装nginx
[root@web01 ~]# yum install -y nginx
4)配置nginx
[root@web01 ~]# vim /etc/nginx/nginx.conf
user www;
5)启动服务
1.方法一:直接启动如果有报错==》重大错误,80端口有占用==》查看占用端口的服务HTTPD,停掉,在重启nginx
[root@web01 ~]# systemctl start nginx
2.方法二:
[root@web01 ~]# nginx
1.查看当前Nginx安装选项
[root@db01 nginx-1.12.2]# nginx -V
[root@db01 nginx-1.12.2]# ./configure --prefix=/usr/share/nginx --sbin-path=/usr/sbin/nginx --modules-path=/usr/lib64/nginx/modules --conf-path=/etc/nginx/nginx.conf --error-log-path=/var/log/nginx/error.log --http-log-path=/var/log/nginx/access.log --http-client-body-temp-path=/var/lib/nginx/tmp/client_body --http-proxy-temp-path=/var/lib/nginx/tmp/proxy --http-fastcgi-temp-path=/var/lib/nginx/tmp/fastcgi --http-uwsgi-temp-path=/var/lib/nginx/tmp/uwsgi --http-scgi-temp-path=/var/lib/nginx/tmp/scgi --pid-path=/run/nginx.pid --lock-path=/run/lock/subsys/nginx --user=nginx --group=nginx --with-compat --with-debug --with-file-aio --with-google_perftools_module --with-http_addition_module --with-http_auth_request_module --with-http_dav_module --with-http_degradation_module --with-http_flv_module --with-http_gunzip_module --with-http_gzip_static_module --with-http_image_filter_module=dynamic --with-http_mp4_module --with-http_perl_module=dynamic --with-http_random_index_module --with-http_realip_module --with-http_secure_link_module --with-http_slice_module --with-http_ssl_module --with-http_stub_status_module --with-http_sub_module --with-http_v2_module --with-http_xslt_module=dynamic --with-mail=dynamic --with-mail_ssl_module --with-pcre --with-pcre-jit --with-stream=dynamic --with-stream_ssl_module --with-stream_ssl_preread_module --with-threads --with-cc-opt='-O2 -g -pipe -Wall -Wp,-D_FORTIFY_SOURCE=2 -fexceptions -fstack-protector-strong --param=ssp-buffer-size=4 -grecord-gcc-switches -specs=/usr/lib/rpm/redhat/redhat-hardened-cc1 -m64 -mtune=generic' --with-ld-opt='-Wl,-z,relro -specs=/usr/lib/rpm/redhat/redhat-hardened-ld -Wl,-E'
2.准备模块
# 下载、解压新包
[root@k8s-n1 packages]# wget http://nginx.org/download/nginx-1.16.1.tar.gz
[root@k8s-n1 packages]# tar xf nginx-1.16.1.tar.gz

#克隆下载 nginx-module-vts 模块
[root@k8s-n1 packages]# git clone https://github.com/vozlt/nginx-module-vts

# .安装GeoIP模块
[root@k8s-n1 packages]# yum -y install epel-release geoip-devel
3.停止Nginx服务
# 停止nginx服务
[root@k8s-n1 packages]# nginx -s stop

# 备份原nginx启动文件
[root@k8s-n1 packages]# which nginx
/usr/sbin/nginx
[root@k8s-n1 packages]# mv /usr/sbin/nginx /usr/sbin/nginx.bak

# 备份原nignx目录
[root@k8s-n1 packages]# mv /etc/nginx nginx-1.12.2.bak
4.编译安装
1> 安装所需依赖
编译安装时可能会出现 `make: *** 没有规则可以创建“default”需要的目标“build”。 停止`的报错,是因为缺少依赖导致

# 管他三七21,装一波儿在进行编译,否则装完依赖还得重新./configure ~
yum install -y gcc gcc++ bash-completion vim lrzsz wget expect net-tools nc nmap tree dos2unix htop iftop iotop unzip telnet sl psmisc nethogs glances bc pcre-devel zlib zlib-devel openssl openssl-devel libxml2 libxml2-dev libxslt-devel gd gd-devel perl-devel perl-ExtUtils-Embed GeoIP GeoIP-devel GeoIP-data pcre-devel
2> 编译安装
- 进入刚刚解压的nginx目录,编译安装
- 基于原来安装参数,尾部追加连个参数
–add-module=/root/packages/nginx-module-vts
–with-http_geoip_module
[root@db01 nginx-1.12.2]# ./configure --prefix=/usr/share/nginx --sbin-path=/usr/sbin/nginx --modules-path=/usr/lib64/nginx/modules --conf-path=/etc/nginx/nginx.conf --error-log-path=/var/log/nginx/error.log --http-log-path=/var/log/nginx/access.log --http-client-body-temp-path=/var/lib/nginx/tmp/client_body --http-proxy-temp-path=/var/lib/nginx/tmp/proxy --http-fastcgi-temp-path=/var/lib/nginx/tmp/fastcgi --http-uwsgi-temp-path=/var/lib/nginx/tmp/uwsgi --http-scgi-temp-path=/var/lib/nginx/tmp/scgi --pid-path=/run/nginx.pid --lock-path=/run/lock/subsys/nginx --user=nginx --group=nginx --with-compat --with-debug --with-file-aio --with-google_perftools_module --with-http_addition_module --with-http_auth_request_module --with-http_dav_module --with-http_degradation_module --with-http_flv_module --with-http_gunzip_module --with-http_gzip_static_module --with-http_image_filter_module=dynamic --with-http_mp4_module --with-http_perl_module=dynamic --with-http_random_index_module --with-http_realip_module --with-http_secure_link_module --with-http_slice_module --with-http_ssl_module --with-http_stub_status_module --with-http_sub_module --with-http_v2_module --with-http_xslt_module=dynamic --with-mail=dynamic --with-mail_ssl_module --with-pcre --with-pcre-jit --with-stream=dynamic --with-stream_ssl_module --with-stream_ssl_preread_module --with-threads --with-cc-opt='-O2 -g -pipe -Wall -Wp,-D_FORTIFY_SOURCE=2 -fexceptions -fstack-protector-strong --param=ssp-buffer-size=4 -grecord-gcc-switches -specs=/usr/lib/rpm/redhat/redhat-hardened-cc1 -m64 -mtune=generic' --with-ld-opt='-Wl,-z,relro -specs=/usr/lib/rpm/redhat/redhat-hardened-ld -Wl,-E' --add-module=/root/package/nginx-module-vts --with-http_geoip_module
# 编译安装
# -j 多核编译(配置低的不建议使用此参数,会卡住~)
[root@k8s-n1 nginx-1.12.2]# make -j && make install
5.配置Nginx
[root@k8s-n1 packages]# cp -r nginx-1.12.2.bak/conf.d/ /etc/nginx/
[root@k8s-n1 packages]# cp -r nginx-1.12.2.bak/nginx.conf /etc/nginx/
[root@k8s-n1 packages]# rm -f /etc/nginx/conf.d/default.conf
配置Nginx配置文件
http层
server层
	···
http {
	···
    include /etc/nginx/conf.d/*.conf;

	##################### 1.http层:添加三行配置 #####################
    vhost_traffic_status_zone;
    vhost_traffic_status_filter_by_host on;
    geoip_country /usr/share/GeoIP/GeoIP.dat;

	##################### 2.server层:指定server层端口号,建议8088端口,不冲突直接复制粘贴即可#####################
    server {
        listen       8088;
        server_name  localhost;
        # 以下vhost配置写在此location内
        location /status {
        vhost_traffic_status on;	# 流量状态,默认即为on,可不写此行
        vhost_traffic_status_display;
        vhost_traffic_status_display_format html;
        vhost_traffic_status_filter_by_set_key $uri uri::$server_name;     #每个uri访问量
        vhost_traffic_status_filter_by_set_key $geoip_country_code country::$server_name;     #不同国家/区域请求量
        vhost_traffic_status_filter_by_set_key $status $server_name;     #http code统计
        vhost_traffic_status_filter_by_set_key $upstream_addr upstream::backend;     #后端>转发统计
        vhost_traffic_status_filter_by_set_key $remote_port client::ports::$server_name;     #请求端口统计
        vhost_traffic_status_filter_by_set_key $remote_addr client::addr::$server_name;     #请求IP统计

        location ~ ^/storage/(.+)/.*$ {
            set $volume $1;
            vhost_traffic_status_filter_by_set_key $volume storage::$server_name;     #请求路径统计
        }
        }
    }
   	##################### server层:可新建一个server,或在原有的不打紧的配置上修改也可以#####################
}
6.启动Nginx
[root@k8s-n1 packages]# nginx
[root@k8s-n1 packages]# netstat -lntp|grep nginx
tcp        0      0 0.0.0.0:80              0.0.0.0:*               LISTEN      62214/nginx: master
tcp        0      0 0.0.0.0:8088            0.0.0.0:*               LISTEN      62214/nginx: master

浏览器访问:
	172.23.0.243:80			# nginx 默认官方页面
	172.23.0.243:8088/status # nignx 监控项页面

7.使用Prometheus监控
- prometheus服务端配置prometheus.yml,并重启prometheus容器
- metrics_path:定义接口后缀类型,默认为/metrics
- 即我们输入ip+端口后,浏览器会自动追加/metrics后缀
[root@k8s-m1 ~]# vim prometheus.yml
···
scrape_configs:
  - job_name: "Nginx"
    metrics_path: '/status/format/prometheus'
    static_configs:
    - targets: ['172.23.0.243:8088']
···
[root@k8s-m1 ~]# docker restart prometheus

# 此时进入prometheus管理页面,则能查询nginx的监控项
8.各个监控项的含义
Nginx-module-vts提供了多种监控项,了解监控项含义,有助于帮助自己生成需要的图表
# HELP nginx_vts_info Nginx info
# TYPE nginx_vts_info gauge
nginx_vts_info{hostname="hbhly_21_205",version="1.16.1"} 1
# HELP nginx_vts_start_time_seconds Nginx start time
# TYPE nginx_vts_start_time_seconds gauge
nginx_vts_start_time_seconds 1584268136.439
# HELP nginx_vts_main_connections Nginx connections
# TYPE nginx_vts_main_connections gauge

# 区分状态的nginx连接数
nginx_vts_main_connections{status="accepted"} 9271
nginx_vts_main_connections{status="active"} 7
nginx_vts_main_connections{status="handled"} 9271
nginx_vts_main_connections{status="reading"} 0
nginx_vts_main_connections{status="requests"} 438850
nginx_vts_main_connections{status="waiting"} 6
nginx_vts_main_connections{status="writing"} 1
# HELP nginx_vts_main_shm_usage_bytes Shared memory [ngx_http_vhost_traffic_status] info
# TYPE nginx_vts_main_shm_usage_bytes gauge

# 内存使用量
nginx_vts_main_shm_usage_bytes{shared="max_size"} 1048575
nginx_vts_main_shm_usage_bytes{shared="used_size"} 24689
nginx_vts_main_shm_usage_bytes{shared="used_node"} 7
# HELP nginx_vts_server_bytes_total The request/response bytes
# TYPE nginx_vts_server_bytes_total counter
# HELP nginx_vts_server_requests_total The requests counter
# TYPE nginx_vts_server_requests_total counter
# HELP nginx_vts_server_request_seconds_total The request processing time in seconds
# TYPE nginx_vts_server_request_seconds_total counter
# HELP nginx_vts_server_request_seconds The average of request processing times in seconds
# TYPE nginx_vts_server_request_seconds gauge
# HELP nginx_vts_server_request_duration_seconds The histogram of request processing time
# TYPE nginx_vts_server_request_duration_seconds histogram
# HELP nginx_vts_server_cache_total The requests cache counter
# TYPE nginx_vts_server_cache_total counter

# 分Host的进出流量
nginx_vts_server_bytes_total{host="10.160.21.205",direction="in"} 22921464
nginx_vts_server_bytes_total{host="10.160.21.205",direction="out"} 1098196005

# 分状态码的请求数量统计 1** 2** 3** 4** 5**
nginx_vts_server_requests_total{host="10.160.21.205",code="1xx"} 0
nginx_vts_server_requests_total{host="10.160.21.205",code="2xx"} 86809
nginx_vts_server_requests_total{host="10.160.21.205",code="3xx"} 0
nginx_vts_server_requests_total{host="10.160.21.205",code="4xx"} 2
nginx_vts_server_requests_total{host="10.160.21.205",code="5xx"} 0
nginx_vts_server_requests_total{host="10.160.21.205",code="total"} 86811

# 响应时间
nginx_vts_server_request_seconds_total{host="10.160.21.205"} 0.000
nginx_vts_server_request_seconds{host="10.160.21.205"} 0.000

# 分状态的缓存的统计
nginx_vts_server_cache_total{host="10.160.21.205",status="miss"} 0
nginx_vts_server_cache_total{host="10.160.21.205",status="bypass"} 0
nginx_vts_server_cache_total{host="10.160.21.205",status="expired"} 0
nginx_vts_server_cache_total{host="10.160.21.205",status="stale"} 0
nginx_vts_server_cache_total{host="10.160.21.205",status="updating"} 0
nginx_vts_server_cache_total{host="10.160.21.205",status="revalidated"} 0
nginx_vts_server_cache_total{host="10.160.21.205",status="hit"} 0
nginx_vts_server_cache_total{host="10.160.21.205",status="scarce"} 0
nginx_vts_server_bytes_total{host="devapi.feedback.test",direction="in"} 3044526
nginx_vts_server_bytes_total{host="devapi.feedback.test",direction="out"} 41257028

# 分状态的连接数的统计
nginx_vts_server_requests_total{host="devapi.feedback.test",code="1xx"} 0
nginx_vts_server_requests_total{host="devapi.feedback.test",code="2xx"} 3983
nginx_vts_server_requests_total{host="devapi.feedback.test",code="3xx"} 0
nginx_vts_server_requests_total{host="devapi.feedback.test",code="4xx"} 24
nginx_vts_server_requests_total{host="devapi.feedback.test",code="5xx"} 11
nginx_vts_server_requests_total{host="devapi.feedback.test",code="total"} 4018
nginx_vts_server_request_seconds_total{host="devapi.feedback.test"} 327.173
nginx_vts_server_request_seconds{host="devapi.feedback.test"} 0.000

# nginx缓存计算器,精确到状态和type
nginx_vts_server_cache_total{host="devapi.feedback.test",status="miss"} 0
nginx_vts_server_cache_total{host="devapi.feedback.test",status="bypass"} 0
nginx_vts_server_cache_total{host="devapi.feedback.test",status="expired"} 0
nginx_vts_server_cache_total{host="devapi.feedback.test",status="stale"} 0
nginx_vts_server_cache_total{host="devapi.feedback.test",status="updating"} 0
nginx_vts_server_cache_total{host="devapi.feedback.test",status="revalidated"} 0
nginx_vts_server_cache_total{host="devapi.feedback.test",status="hit"} 0
nginx_vts_server_cache_total{host="devapi.feedback.test",status="scarce"} 0
nginx_vts_server_bytes_total{host="testapi.feedback.test",direction="in"} 55553573
nginx_vts_server_bytes_total{host="testapi.feedback.test",direction="out"} 9667561188
nginx_vts_server_requests_total{host="testapi.feedback.test",code="1xx"} 0
nginx_vts_server_requests_total{host="testapi.feedback.test",code="2xx"} 347949
nginx_vts_server_requests_total{host="testapi.feedback.test",code="3xx"} 31
nginx_vts_server_requests_total{host="testapi.feedback.test",code="4xx"} 7
nginx_vts_server_requests_total{host="testapi.feedback.test",code="5xx"} 33
nginx_vts_server_requests_total{host="testapi.feedback.test",code="total"} 348020
nginx_vts_server_request_seconds_total{host="testapi.feedback.test"} 2185.177
nginx_vts_server_request_seconds{host="testapi.feedback.test"} 0.001
nginx_vts_server_cache_total{host="testapi.feedback.test",status="miss"} 0
nginx_vts_server_cache_total{host="testapi.feedback.test",status="bypass"} 0
nginx_vts_server_cache_total{host="testapi.feedback.test",status="expired"} 0
nginx_vts_server_cache_total{host="testapi.feedback.test",status="stale"} 0
nginx_vts_server_cache_total{host="testapi.feedback.test",status="updating"} 0
nginx_vts_server_cache_total{host="testapi.feedback.test",status="revalidated"} 0
nginx_vts_server_cache_total{host="testapi.feedback.test",status="hit"} 0
nginx_vts_server_cache_total{host="testapi.feedback.test",status="scarce"} 0
nginx_vts_server_bytes_total{host="*",direction="in"} 81519563
nginx_vts_server_bytes_total{host="*",direction="out"} 10807014221

# 分host请求数量统计
nginx_vts_server_requests_total{host="*",code="1xx"} 0
nginx_vts_server_requests_total{host="*",code="2xx"} 438741
nginx_vts_server_requests_total{host="*",code="3xx"} 31
nginx_vts_server_requests_total{host="*",code="4xx"} 33
nginx_vts_server_requests_total{host="*",code="5xx"} 44
nginx_vts_server_requests_total{host="*",code="total"} 438849
nginx_vts_server_request_seconds_total{host="*"} 2512.350
nginx_vts_server_request_seconds{host="*"} 0.007

# 分host缓存统计
nginx_vts_server_cache_total{host="*",status="miss"} 0
nginx_vts_server_cache_total{host="*",status="bypass"} 0
nginx_vts_server_cache_total{host="*",status="expired"} 0
nginx_vts_server_cache_total{host="*",status="stale"} 0
nginx_vts_server_cache_total{host="*",status="updating"} 0
nginx_vts_server_cache_total{host="*",status="revalidated"} 0
nginx_vts_server_cache_total{host="*",status="hit"} 0
nginx_vts_server_cache_total{host="*",status="scarce"} 0
# HELP nginx_vts_upstream_bytes_total The request/response bytes
# TYPE nginx_vts_upstream_bytes_total counter
# HELP nginx_vts_upstream_requests_total The upstream requests counter
# TYPE nginx_vts_upstream_requests_total counter
# HELP nginx_vts_upstream_request_seconds_total The request Processing time including upstream in seconds
# TYPE nginx_vts_upstream_request_seconds_total counter
# HELP nginx_vts_upstream_request_seconds The average of request processing times including upstream in seconds
# TYPE nginx_vts_upstream_request_seconds gauge
# HELP nginx_vts_upstream_response_seconds_total The only upstream response processing time in seconds
# TYPE nginx_vts_upstream_response_seconds_total counter
# HELP nginx_vts_upstream_response_seconds The average of only upstream response processing times in seconds
# TYPE nginx_vts_upstream_response_seconds gauge
# HELP nginx_vts_upstream_request_duration_seconds The histogram of request processing time including upstream
# TYPE nginx_vts_upstream_request_duration_seconds histogram
# HELP nginx_vts_upstream_response_duration_seconds The histogram of only upstream response processing time
# TYPE nginx_vts_upstream_response_duration_seconds histogram

# 分upstream流量统计
nginx_vts_upstream_bytes_total{upstream="::nogroups",backend="10.144.227.162:80",direction="in"} 12296
nginx_vts_upstream_bytes_total{upstream="::nogroups",backend="10.144.227.162:80",direction="out"} 13582924
nginx_vts_upstream_requests_total{upstream="::nogroups",backend="10.144.227.162:80",code="1xx"} 0
nginx_vts_upstream_requests_total{upstream="::nogroups",backend="10.144.227.162:80",code="2xx"} 25
nginx_vts_upstream_requests_total{upstream="::nogroups",backend="10.144.227.162:80",code="3xx"} 0
nginx_vts_upstream_requests_total{upstream="::nogroups",backend="10.144.227.162:80",code="4xx"} 0
nginx_vts_upstream_requests_total{upstream="::nogroups",backend="10.144.227.162:80",code="5xx"} 0
nginx_vts_upstream_requests_total{upstream="::nogroups",backend="10.144.227.162:80",code="total"} 25
nginx_vts_upstream_request_seconds_total{upstream="::nogroups",backend="10.144.227.162:80"} 1.483
nginx_vts_upstream_request_seconds{upstream="::nogroups",backend="10.144.227.162:80"} 0.000
nginx_vts_upstream_response_seconds_total{upstream="::nogroups",backend="10.144.227.162:80"} 1.484
nginx_vts_upstream_response_seconds{upstream="::nogroups",backend="10.144.227.162:80"} 0.000
nginx_vts_upstream_bytes_total{upstream="::nogroups",backend="10.152.218.149:80",direction="in"} 12471
nginx_vts_upstream_bytes_total{upstream="::nogroups",backend="10.152.218.149:80",direction="out"} 11790508
nginx_vts_upstream_requests_total{upstream="::nogroups",backend="10.152.218.149:80",code="1xx"} 0
nginx_vts_upstream_requests_total{upstream="::nogroups",backend="10.152.218.149:80",code="2xx"} 24
nginx_vts_upstream_requests_total{upstream="::nogroups",backend="10.152.218.149:80",code="3xx"} 0
nginx_vts_upstream_requests_total{upstream="::nogroups",backend="10.152.218.149:80",code="4xx"} 0
nginx_vts_upstream_requests_total{upstream="::nogroups",backend="10.152.218.149:80",code="5xx"} 0
nginx_vts_upstream_requests_total{upstream="::nogroups",backend="10.152.218.149:80",code="total"} 24
nginx_vts_upstream_request_seconds_total{upstream="::nogroups",backend="10.152.218.149:80"} 1.169
nginx_vts_upstream_request_seconds{upstream="::nogroups",backend="10.152.218.149:80"} 0.000
nginx_vts_upstream_response_seconds_total{upstream="::nogroups",backend="10.152.218.149:80"} 1.168
nginx_vts_upstream_response_seconds{upstream="::nogroups",backend="10.152.218.149:80"} 0.000
nginx_vts_upstream_bytes_total{upstream="::nogroups",backend="10.160.21.205:8081",direction="in"} 3036924
nginx_vts_upstream_bytes_total{upstream="::nogroups",backend="10.160.21.205:8081",direction="out"} 33355357
nginx_vts_upstream_requests_total{upstream="::nogroups",backend="10.160.21.205:8081",code="1xx"} 0
nginx_vts_upstream_requests_total{upstream="::nogroups",backend="10.160.21.205:8081",code="2xx"} 3971
nginx_vts_upstream_requests_total{upstream="::nogroups",backend="10.160.21.205:8081",code="3xx"} 0
nginx_vts_upstream_requests_total{upstream="::nogroups",backend="10.160.21.205:8081",code="4xx"} 24
nginx_vts_upstream_requests_total{upstream="::nogroups",backend="10.160.21.205:8081",code="5xx"} 11
nginx_vts_upstream_requests_total{upstream="::nogroups",backend="10.160.21.205:8081",code="total"} 4006
nginx_vts_upstream_request_seconds_total{upstream="::nogroups",backend="10.160.21.205:8081"} 326.427
nginx_vts_upstream_request_seconds{upstream="::nogroups",backend="10.160.21.205:8081"} 0.000
nginx_vts_upstream_response_seconds_total{upstream="::nogroups",backend="10.160.21.205:8081"} 300.722
nginx_vts_upstream_response_seconds{upstream="::nogroups",backend="10.160.21.205:8081"} 0.000
nginx_vts_upstream_bytes_total{upstream="::nogroups",backend="10.160.21.205:8082",direction="in"} 55536408
nginx_vts_upstream_bytes_total{upstream="::nogroups",backend="10.160.21.205:8082",direction="out"} 9650089427
nginx_vts_upstream_requests_total{upstream="::nogroups",backend="10.160.21.205:8082",code="1xx"} 0
nginx_vts_upstream_requests_total{upstream="::nogroups",backend="10.160.21.205:8082",code="2xx"} 347912
nginx_vts_upstream_requests_total{upstream="::nogroups",backend="10.160.21.205:8082",code="3xx"} 31
nginx_vts_upstream_requests_total{upstream="::nogroups",backend="10.160.21.205:8082",code="4xx"} 7
nginx_vts_upstream_requests_total{upstream="::nogroups",backend="10.160.21.205:8082",code="5xx"} 33
nginx_vts_upstream_requests_total{upstream="::nogroups",backend="10.160.21.205:8082",code="total"} 347983
nginx_vts_upstream_request_seconds_total{upstream="::nogroups",backend="10.160.21.205:8082"} 2183.271
nginx_vts_upstream_request_seconds{upstream="::nogroups",backend="10.160.21.205:8082"} 0.001
nginx_vts_upstream_response_seconds_total{upstream="::nogroups",backend="10.160.21.205:8082"} 2180.893
nginx_vts_upstream_response_seconds{upstream="::nogroups",backend="10.160.21.205:8082"} 0.001
9.Prometheus UI中Target表达式查询
1)CAdvisor中获取的典型监控指标
| 指标名称 | 类型 | 含义 |
|---|---|---|
| container_cpu_load_average_10s | gauge | 过去10秒内容器CPU的平均负载 |
| container_cpu_usage_seconds_total | counter | 容器在每个CPU内核上的累积占用时间 (单位:秒) |
| container_cpu_system_seconds_total | counter | System CPU累积占用时间(单位:秒) |
| container_cpu_user_seconds_total | counter | User CPU累积占用时间(单位:秒) |
| container_fs_usge_bytes | gauge | 容器中文件系统的使用量(单位:字节) |
| container_network_receive_bytes_total | counter | 容器网络累计接受数据总量(单位: 字节) |
| container_network_transmit_bytes_total | counter | 容器网络累计传输数据总量(单位: 字节) |
2)容器相关
# 容器的CPU使用率
sum(irate(container_cpu_usage_seconds_total{image!=""}[1m])) without (cpu)

# 容器内存使用量(单位: 字节)
container_memory_usage_bytes{image!=""}

# 容器网络接收量速率(单位: 字节/秒)
sum(rate(container_network_receive_bytes_total{image!=""}[1m])) without (interface)

# 容器网络传输量速率
sum(rate(container_network_transmit_bytes_total{image!=""}[1m])) without (interface)

# 容器文件系统读取速率
sum(rate(container_fs_reads_bytes_total{image!=""}[1m])) without (device)

# 容器文件系统写入速率(单位: 字节/秒)
sum(rate(container_fs_writes_bytes_total{image!=""}[1m])) without (device)
3)http相关
# HTTP请求总数
prometheus_http_requests_total

# HTTP请求持续时间秒桶
prometheus_http_request_duration_seconds_bucket

# HTTP请求持续时间秒数计数
prometheus_http_request_duration_seconds_count

# HTTP请求持续时间秒数之和
prometheus_http_request_duration_seconds_sum

# HTTP响应大小字节
prometheus_http_response_size_bytes_bucket

# HTTP响应大小字节计数计数
prometheus_http_response_size_bytes_count

# HTTP响应大小字节的总和
prometheus_http_response_size_bytes_sum
4)Nginx相关
# Nginxvts过滤字节总数
nginx_vts_filter_bytes_total

# Nginx VTS过滤器缓存总数
nginx_vts_filter_cache_total

# Nginx VTS过滤请求秒数
nginx_vts_filter_request_seconds

# Nginx VTS过滤器请求总秒数
nginx_vts_filter_request_seconds_total

# Nginx VTS过滤器请求总数
nginx_vts_filter_requests_total

# nginx信息
nginx_vts_info

# Nginx VTS主连接
nginx_vts_main_connections

# Nginx VTS主SHM使用字节
nginx_vts_main_shm_usage_bytes

# Nginx VTS服务器字节总数
nginx_vts_server_bytes_total

# Nginx VTS服务器缓存总数
nginx_vts_server_cache_total

# Nginx_vts服务器请求秒
nginx_vts_server_request_seconds

# Nginx_vts服务器请求总秒数
nginx_vts_server_request_seconds_total

# Nginx_vts服务总请求数
nginx_vts_server_requests_total

# Nginx VTS开始时间秒数
nginx_vts_start_time_seconds
10.安装blackbox_exporter
- blackbox收集服务状态信息,如判断服务http请求是否返回200继而报警
- blackbox_exporter是Prometheus 官方提供的 exporter 之一,可以提供 http、dns、tcp、icmp 的监控数据采集
功能:
HTTP 测试
    定义 Request Header 信息
    判断 Http status / Http Respones Header / Http Body 内容

TCP 测试
    业务组件端口状态监听
    应用层协议定义与监听

ICMP 测试
	主机探活机制

POST 测试
	接口联通性

SSL 证书过期时间

# 下载、解压
[root@11 Prometheus]# wget https://github.com/prometheus/blackbox_exporter/releases/download/v0.14.0/blackbox_exporter-0.14.0.linux-amd64.tar.gz
[root@11 Prometheus]# tar -xvf blackbox_exporter-0.14.0.linux-amd64.tar.gz
[root@11 Prometheus]# mv blackbox_exporter-0.14.0.linux-amd64 /usr/local/blackbox_exporter

# 查看安装是否成功
[root@11 Prometheus]# /usr/local/blackbox_exporter/blackbox_exporter --version
blackbox_exporter, version 0.14.0 (branch: HEAD, revision: bba7ef76193948a333a5868a1ab38b864f7d968a)
  build user:       root@63d11aa5b6c6
  build date:       20190315-13:32:31
  go version:       go1.11.5

# 加入systemd管理
[root@11 Prometheus]# cat /usr//lib/systemd/system/blackbox_exporter.service
[Unit]
Description=blackbox_exporter

[Service]
User=root
Type=simple
ExecStart=/usr/local/blackbox_exporter/blackbox_exporter --config.file=/usr/local/blackbox_exporter/blackbox.yml
Restart=on-failure
[root@11 Prometheus]#

# 启动
[root@11 Prometheus]# systemctl daemon-reload
[root@11 Prometheus]# systemctl enable --now blackbox_exporter
11.Docker部署nginx-module-vts模块
由于yum安装的nginx,默认是没有nginx-module-vts模块的,需要下载对应的nginx源码,进行重新编译才行。
Docker 搭建 Consul集群(未完)
1.启动第一个consul服务:consul1
docker run --name consul1 -d -p 8500:8500 -p 8300:8300 -p 8301:8301 -p 8302:8302 -p 8600:8600 --restart=always consul:latest agent -server -bootstrap-expect 2 -ui -bind=0.0.0.0 -client=0.0.0.0

# 获取 consul server1 的 ip 地址
docker inspect --format '{{ .NetworkSettings.IPAddress }}' consul1
172.17.0.2

# PS:
    8500 http 端口,用于 http 接口和 web ui
    8300 server rpc 端口,同一数据中心 consul server 之间通过该端口通信
    8301 serf lan 端口,同一数据中心 consul client 通过该端口通信
    8302 serf wan 端口,不同数据中心 consul server 通过该端口通信
    8600 dns 端口,用于服务发现
    -bbostrap-expect 2: 集群至少两台服务器,才能选举集群leader
    -ui:运行 web 控制台
    -bind: 监听网口,0.0.0.0 表示所有网口,如果不指定默认为127.0.0.1,则无法和容器通信
    -client : 限制某些网口可以访问
2.启动第二个consul服务:consul2, 并加入consul1(使用join命令)
docker run -d --name consul2 -d -p 8501:8500 consul agent -server -ui -bind=0.0.0.0 -client=0.0.0.0 -join 172.17.0.2

docker run -d -p 8501:8500 --restart=always -v /XiLife/consul/data/server3:/consul/data -v /XiLife/consul/conf/server2:/consul/config -e CONSUL_BIND_INTERFACE='eth0' --privileged=true --name=consu2 consul agent -server -ui -node=consul2 -client='0.0.0.0' -datacenter=xdp_dc -data-dir /consul/data -config-dir /consul/config -join=172.17.0.2
3.启动第三个consul服务:consul3,并加入consul1
docker run --name consul3 -d -p 8502:8500 consul agent -server -ui -bind=0.0.0.0 -client=0.0.0.0 -join 172.17.0.2
4.查看运行的容器(consul集群状态)
[root@k8s-m1 consul]# docker exec -it consul1 consul members
Node          Address          Status  Type    Build   Protocol  DC   Segment
013a4a7e74d2  172.17.0.4:8301  alive   server  1.10.0  2         dc1  <all>
3c118fa83d47  172.17.0.3:8301  alive   server  1.10.0  2         dc1  <all>
4b5123c97c2b  172.17.0.5:8301  alive   server  1.10.0  2         dc1  <all>
a7d272ad157a  172.17.0.2:8301  alive   server  1.10.0  2         dc1  <all>
5.服务注册与剔除
- 接下来,我们要注册服务到 Consul 中,可以通过其提供的 API 标准接口来添加
- 那么先注册一个测试服务,该测试数据为本机
node-exporter服务信息,服务地址及端口为node-exporter默认提供指标数据的地址,执行如下命令
# 注册241的 node-exporter 服务信息
curl -X PUT -d '{"id": "node-exporter","name": "node-exporter-172.23.0.241","address": "172.23.0.241","port": 9100,"tags": ["prometheus"],"checks": [{"http": "http://172.23.0.241:9100/metrics", "interval": "5s"}]}'  http://172.23.0.241:8500/v1/agent/service/register

# 注册242的 node-exporter 服务信息
将上面所有IP地址改为242的即可,端口不变
如果要注销掉某个服务,可以通过如下 API 命令操作,例如注销上边添加的 node-exporter 服务
curl -X PUT http://172.23.0.241:8500/v1/agent/service/deregister/node-exporter
附:升级Centos6内核
rpm -Uvh https://hkg.mirror.rackspace.com/elrepo/kernel/el6/x86_64/RPMS/elrepo-release-6-12.el6.elrepo.noarch.rpm

yum源报错解决:找不到镜像源
cd /etc/yum.repos.d
mv CentOS-Base.repo CentOS-Base.repo.backup
wget http://mirrors.163.com/.help/CentOS6-Base-163.repo
mv CentOS6-Base-163.repo CentOS-Base.repo
yum clean all
wget -O /etc/yum.repos.d/CentOS-Base.repo http://file.kangle.odata.cc/repo/Centos-6.repo
wget -O /etc/yum.repos.d/epel.repo http://file.kangle.odata.cc/repo/epel-6.repo
yum makecache
到此这篇关于Docker 部署 Prometheus的文章就介绍到这了,更多相关Docker 部署 Prometheus内容请搜索我们以前的文章或继续浏览下面的相关文章希望大家以后多多支持我们!
相关推荐
-

基于docker 搭建Prometheus+Grafana的过程详解
一.介绍Prometheus Prometheus(普罗米修斯)是一套开源的监控&报警&时间序列数据库的组合,起始是由SoundCloud公司开发的.随着发展,越来越多公司和组织接受采用Prometheus,社会也十分活跃,他们便将它独立成开源项目,并且有公司来运作.Google SRE的书内也曾提到跟他们BorgMon监控系统相似的实现是Prometheus.现在最常见的Kubernetes容器管理系统中,通常会搭配Prometheus进行监控. Prometheus基本原理是通过HTT
-
Docker 部署 Prometheus的安装详细教程
目录 1.安装Node Exporter 2.安装cAdvisor 3.安装 Prometheus Server 4.创建运行Grafana 5.添加监控模板 6.键值查询 7.使用Prometheus监控 8.各个监控项的含义 9.Prometheus UI中Target表达式查询 10.安装blackbox_exporter 11.Docker部署nginx-module-vts模块 Docker 搭建 Consul集群(未完) Docker 部署 Prometheus 说明: 监控端安装:
-
centos8使用Docker部署Django项目的详细教程
引言 在本文中将介绍在Docker中通过django + uwsgi + nginx部署方式部署Django项目, 由于记录的是学习过程,使用的都是目前较高的版本. python 版本为3.8.3 django 版本为3.0.6 nginx 版本为1.17.10 好了简单的介绍之后,就进入正题了. 创建一个工作目录 创建一个工作目录用来存放项目,和Dockerfile等文件. mkdir uwsgidocker 简单说明一下各个文件 docker-compose.yml: Docker
-
Armbian5.9.0安装docker及部署可视化portainer的详细教程
目录 安装 docker 如何查看 docker 是否安装成功? 如何启动docker? 如何安装可视化portainer 安装英文版本 安装中文版 什么是docker?Docker是一个开源的引擎,可以轻松的为任何应用创建一个轻量级的.可移植的.自给自足的容器.开发者在笔记本上编译测试通过的容器可以批量地在生产环境中部署,包括VMs(虚拟机). bare metal.OpenStack 集群和其他的基础应用平台. Docker通常用于如下场景: web应用的自动化打包和发布: 自动化测试和持续
-
docker-compose部署配置jenkins的详细教程
docker-compose部署配置jenkins 一.docker-compose文件 version: '3.1' services: jenkins: image: jenkins/jenkins:lts volumes: - /data/jenkins/:/var/jenkins_home - /var/run/docker.sock:/var/run/docker.sock - /usr/bin/docker:/usr/bin/docker - /usr/lib/x86_64-lin
-
SpringBoot应用快速部署到K8S的详细教程
欢迎访问我的GitHub https://github.com/zq2599/blog_demos 内容: 所有原创文章分类汇总及配套源码,涉及Java.Docker.Kubernetes.DevOPS等: 背景 对于生产环境,我们一般会用CI&&CD工具完成整个构建和部署,因此本文不适合生产环境:对于学习和开发环境,我们频繁修改代码,又想快速见到效果,本文就是针对这种场景的: 内容简介 如果您正在开发SpringBoot应用,并且应用部署在K8S环境,可以参考本文将应用快速部署到K8S环
-
k3d入门指南之在Docker中运行K3s的详细教程
什么是k3d? k3d是一个小型程序,用于在Docker中运行K3s集群. K3s是经过CNCF认证的轻量级Kubernetes发行和沙箱项目.它是为资源有限环境设计的,被打包为单个二进制文件,所需RAM小于512MB. 要了解有关K3s的更多信息,请查看我们之前的公众号文章及B站上的视频. k3d借助从K3s仓库构建的Docker镜像在安装了Docker的任何机器上的Docker容器中启动多个K3s节点. 这样,一台物理(或虚拟)机(称为Docker Host)可以运行多个K3s集群,每个集群
-
CentOS8上用Docker部署开源项目Tcloud的教程
一.安装Docker 1.我是虚拟机装的Centos7,linux 3.10 内核,docker官方说至少3.8以上,建议3.10以上(ubuntu下要linux内核3.8以上) root账户登录,查看内核版本如下 uname -a 2.把yum包更新到最新 yum update (期间要选择确认,输入 y 即可) 3.安装需要的软件包,yum-util 提供yum-config-manager功能,另外两个是devicemapper驱动依赖的 yum install -y yum-utils
-
CentOS下宝塔部署Django项目的详细教程
基础环境 装好宝塔服务 宝塔里装好[Python项目管理器] 宝塔里装好[Nginx] 把Django项目代码发到服务器 把代码放到服务器上有两种方法: 方法一:服务器上安装Git,通过Git Clone代码到服务器上 方法二:通过宝塔的FTP工具把代码上传上去 注意: 在目录:/www/wwwroot/下新建一个文件夹, 把代码需要放到新建的目录中 创建Python(Django)项目 现在我们开始创建 python 项目.打开首页的 python 项目管理器,点击 添加项目.填充数据: *
-
服务器使用Nginx部署Springboot项目的详细教程(jar包)
1,将java项目打成jar包 这里我用到的是maven工具 这里有两个项目,打包完成后一个为demo.jar,另一个为jst.jar 2.准备工具 1.服务器 2.域名(注:经过备案) 3.Xshell用于连接服务器 4.WinScp(注:视图工具,用于传输jar) 3.将jar包传入服务器 直接拖动即可 3.使用Xshell运行jar包 注:(服务器的java环境以及maven环境,各位请自行配置,这里不做描述.) cd到jar包路径下执行:nohup java -jar demo.jar
-
如何利用Gitlab-ci持续部署到远程机器(详细教程)
长话短说,今天聊一聊使用Gitlab-CI 自动部署到远程服务器. 看过这篇文章的朋友,会注意到我是在 Gitlab-Runner服务器上自动部署的站点,本次我们结合ssh部署到远程机器(将CI服务器和部署服务器分离,避免资源抢占). SSH免密登陆 还是那句话,CI/CD实质是将我们手动集成.拷贝部署的方式脚本化,远程部署的重要姿势是要求免密操控. 要让Gitlab Runner部署到远程机器,远程机器必须信任gitlab runner账户. 先执行su gitlab-runner切换到git